
The Bold BI dashboard designer supports connecting Infusionsoft web services through REST API.
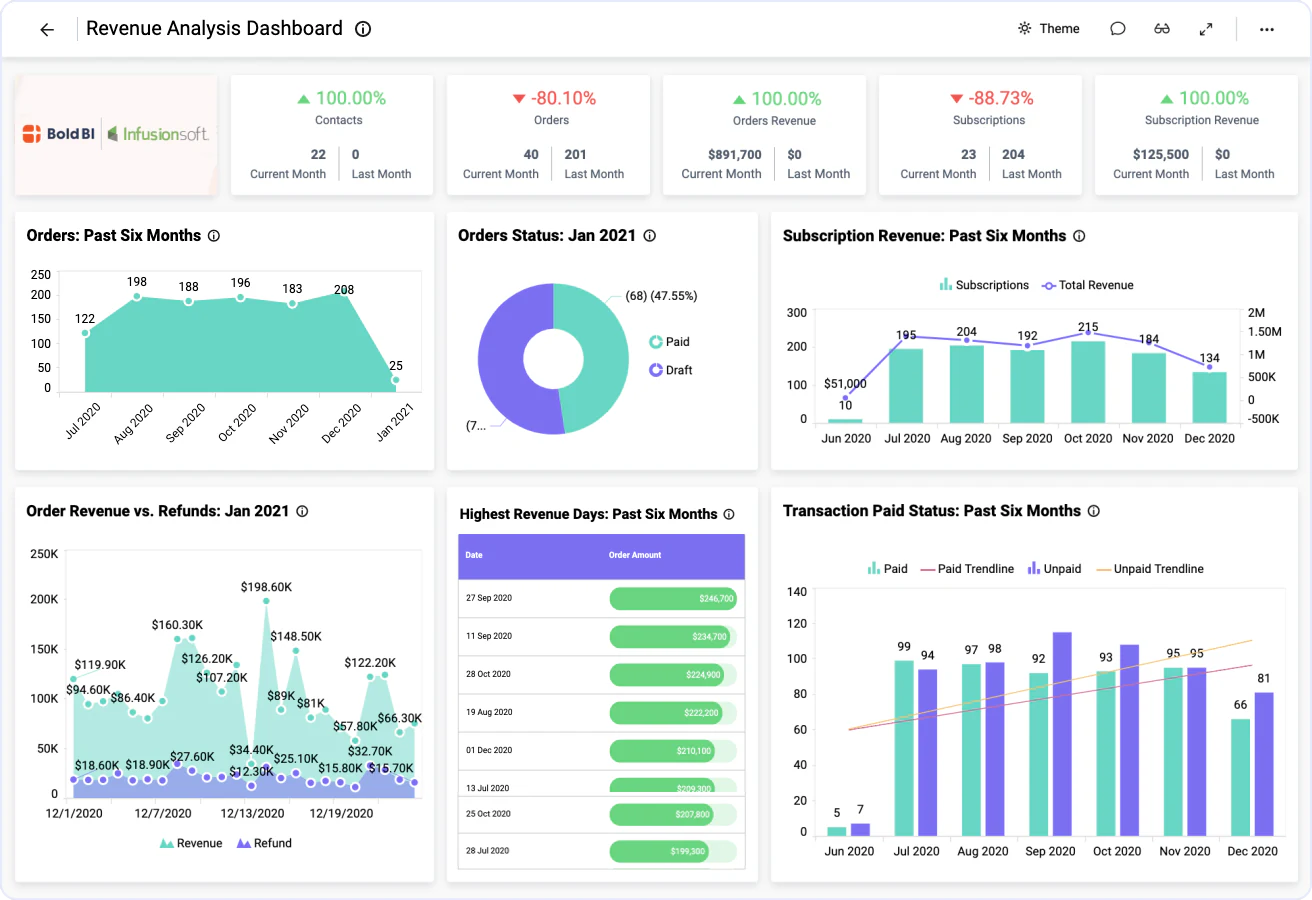
Bring your Infusionsoft data to Bold BI® and create beautiful dashboards with useful widgets. By embedding dashboards inside your application, you can visualize the story behind your data and make effective business decisions.
State the maximum number of rows to be fetched from Infusionsoft connector.
Configure data refresh to keep your dashboard up to date.
Join Infusionsoft data with data from different data sources using shared tables.
This Infusionsoft Revenue Analysis Dashboard provides a complete view of your data trends. This includes key sales metrics and customer service metrics. Of course, this can also include order and subscription information. Therefore, you only need one dashboard to track overall revenue progress.
Integrate Infusionsoft data with other integrations, like SQL or web data sources, and create dashboards with multiple data sources. Embed these dashboards into your application for powerful data visualization.
Integrations
Your data, wherever it lives. SQL databases, REST APIs, cloud warehouses, flat files, and SaaS tools connect without a custom pipeline.





Explore Bold BI with a 30-day free trial. Embed dashboards, connect data sources, and empower your team with actionable insights.
No credit card required.