
Bold BI dashboard designer supports connecting ActiveCampaign web services through REST API.
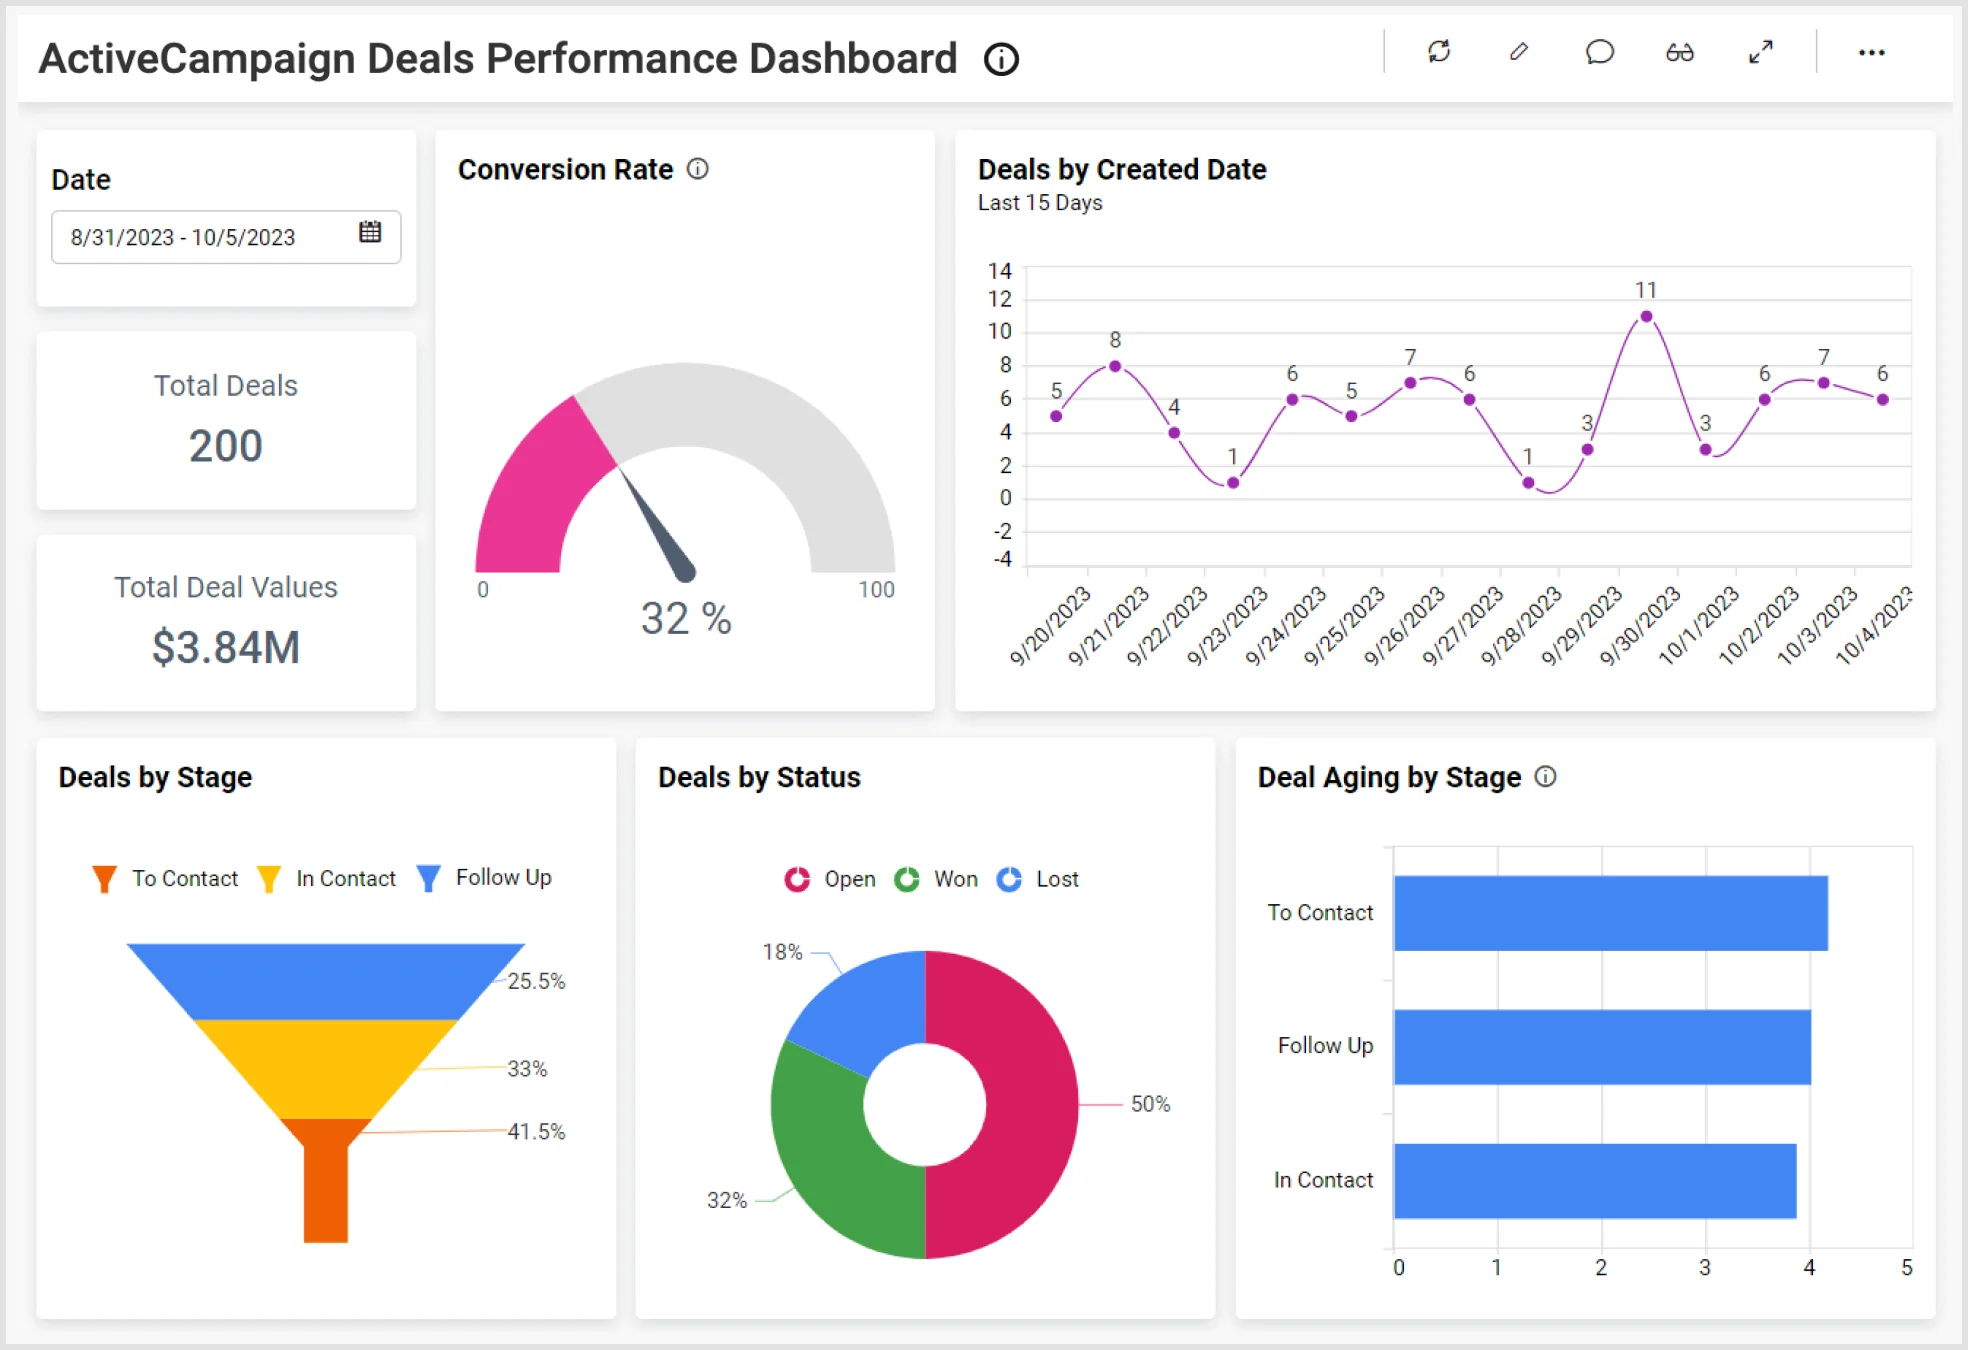
Bring your ActiveCampaign data to Bold BI® and create beautiful dashboards with useful widgets. By embedding dashboards inside your application, you can visualize the story behind your data and make effective business decisions.
Create your query URL with valid REST API Endpoints that retrieves data from the ActiveCampaign account.
Set the maximum number of rows to be fetched from ActiveCampaign connector.
Join the ActiveCampaign data with data from different sources using shared tables.
Configure data refresh to keep your dashboard up to date.
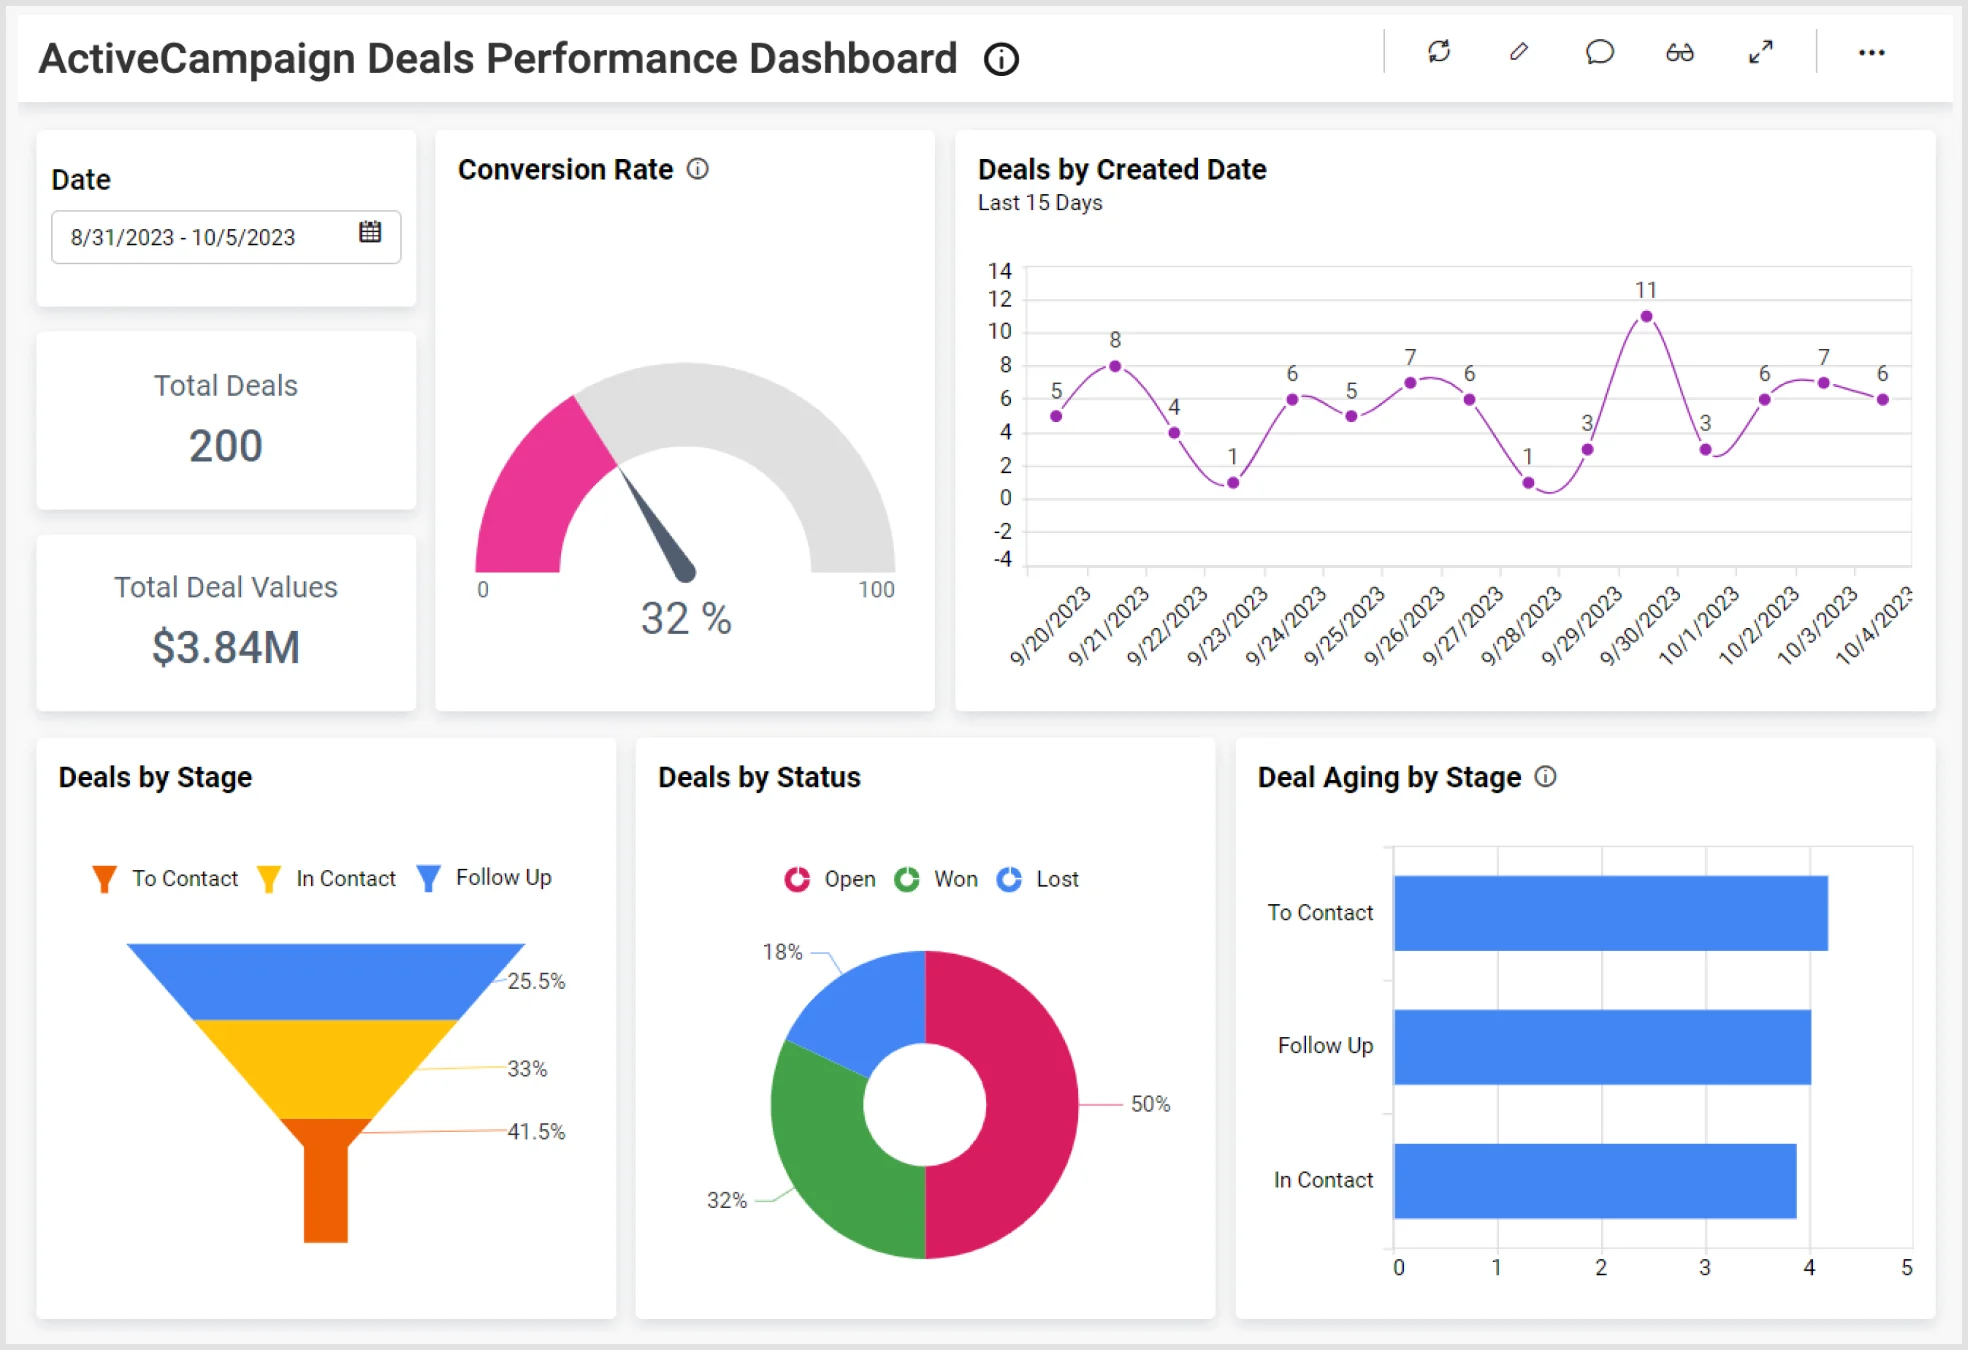
The Active Campaign Deals Performance Dashboard empowers sales teams to gain real-time insights into the status of their deals, enabling them to optimize strategies, enhance collaboration, and maximize revenue generation.
Combine ActiveCampaign data with other integrations, like SQL or web data sources, and create dashboards with multiple data sources. Embed these dashboards into your applications for powerful data visualization.
Integrations
Your data, wherever it lives. SQL databases, REST APIs, cloud warehouses, flat files, and SaaS tools connect without a custom pipeline.





Explore Bold BI with a 30-day free trial. Embed dashboards, connect data sources, and empower your team with actionable insights.
No credit card required.