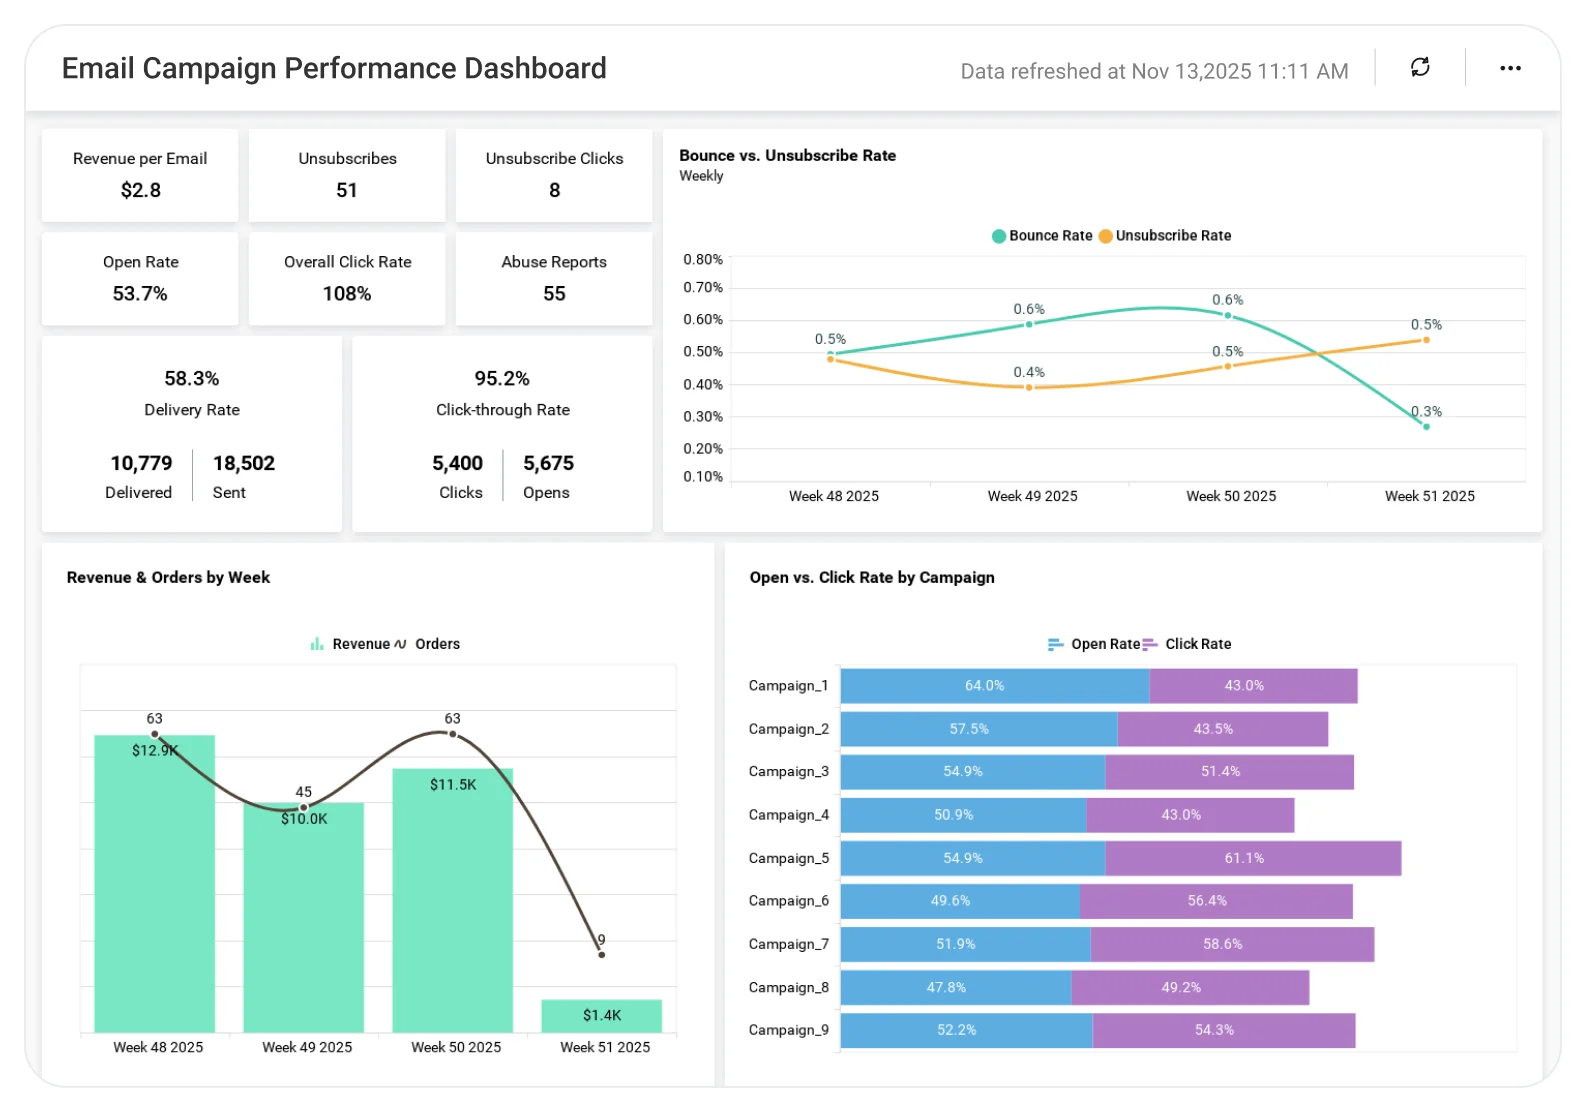
Email Campaign Performance Dashboard
Understand email campaign performance to improve engagement and conversion results.
The Email Campaign Performance Dashboard helps teams analyze open rates, click-through rates, conversions, and campaign effectiveness, enabling better content optimization, audience targeting, and stronger email marketing outcomes.
TL;DR
-
Total emails sent and successfully delivered.
-
Open rates, click rates, and unique subscriber clicks.
-
Unsubscribe and abuse reports.
-
Campaign-level engagement comparisons.
-
Investment vs. revenue by campaign type.
-
Clear visibility into email ROI.
What Is an Email Campaign Performance Dashboard?
An Email Campaign Performance Dashboard is a visual analytics tool that tracks email delivery, engagement, subscriber behavior, and revenue impact.
In Bold BI, it becomes an interactive, drillable dashboard that helps marketing teams evaluate engagement trends, campaign ROI, and audience response which are updated automatically from connected data sources.
Why Email Campaign Performance Dashboard Matters
Email remains one of the highest-ROI marketing channels, but only when performance is monitored closely.
Without a unified view, key metrics often live across ESP reports and spreadsheets, making it difficult to answer questions like:
-
How many emails were sent and delivered successfully?
-
How many customers opened emails and clicked links?
-
Are unsubscribed or abuse reports increasing?
-
How much are we spending on campaigns and what revenue are we generating?
Bold BI answers these questions in one dashboard, helping marketing leaders focus on what’s working and fix what’s not.
What You’ll Track
-
Email delivery performance: Emails sent and delivered, helping teams monitor campaign reach and delivery success.
-
Engagement metrics: Total opens, clicks, and unique subscriber clicks to measure audience interaction.
-
Subscriber health indicators: Unsubscribe and abuse reports to quickly identify engagement risks or list quality issues.
-
Engagement trends over time: Open rate vs. click rate trends by date and by campaign to evaluate timing, frequency, and effectiveness.
-
Campaign investment & revenue: Campaign-wise cost versus revenue to assess ROI, identify high-performing campaigns, and guide budget allocation.
All dashboards are fully customizable so you can add KPIs or metrics as needed.
How It Works
-
Apply the Email Campaign Performance Dashboard sample.
-
Combine engagement, cost, and revenue data for full-funnel insight.
-
Share dashboards securely with marketing teams and leadership.
-
Act on insights to improve engagement and maximize ROI.
Why Bold BI Is the Right Fit for Email Campaign Performance Analytics
-
Combines engagement, subscriber behavior, and revenue metrics in one dashboard.
-
Interactive charts with drilldowns for campaign-level and time-based analysis.
-
Helps marketing leaders spot trends, risks, and ROI opportunities quickly.
-
Supports secure sharing with role-based access for executives and teams.
-
Flexible deployment options to fit modern marketing data environments.
Compare Options (at a glance)
| Feature | Bold BI | Email Marketing Tool Reports | Spreadsheets |
| Open, click & conversion tracking | Yes | Limited | Manual |
| Campaign performance trends over time | Yes | Limited | Manual |
| Audience & segment-level insights | Yes | Limited | Manual |
| ROI & revenue attribution analysis | Yes | Limited | No |
| Executive-ready dashboards | Yes | Limited | No |
Frequently Asked Questions
More Articles About Email Marketing & Campaign Analytics
-
Effectively Monitor Email Marketing Campaigns with Embedded Analytics
 Explains how teams can track key email campaign metrics like sends, opens, clicks, and engagement trends using dashboards to improve performance.
-
Boost Campaign Performance with MailChimp & Salesforce Data
Shows how combining data from Mailchimp and Salesforce helps marketers analyze campaign performance and engagement across platforms.