

Embedded Analytics Pricing: How to Choose the Right Model
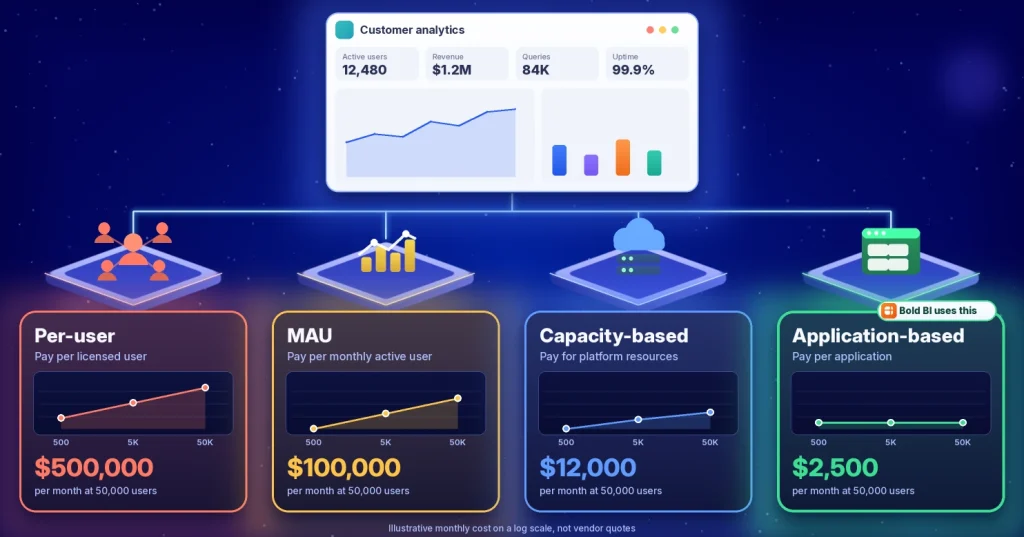
TL;DR: The cheapest embedded analytics pricing model at 500 users is rarely the cheapest at 50,000 users. Whether pricing is tied to users, usage, capacity, or applications directly affects scalability, budgeting, and long-term profitability. Bold BI uses application-based licensing, helping organizations avoid per-user and per-viewer fees while planning for long-term growth.
Most embedded analytics pricing decisions are made based on current usage. The challenge is that embedded analytics costs rarely remain tied to current usage for long. As customer adoption grows, your pricing model matters more than your starting price.
Unlike traditional BI deployments that primarily support internal teams, embedded analytics is delivered directly to customers, partners, and external users. In many cases, the more successful your product becomes, the more analytics users you must support. A pricing model that charges for every user, every view, or every interaction can turn growth into a growing licensing expense.
The four embedded analytics pricing models
Different pricing models charge for different things. What matters most isn’t the starting price, but what drives your costs up over time.
| Pricing model | What you pay for | Cost driver | Best for | Potential challenge |
| Per-User Pricing | Licensed users | User growth | Internal analytics and smaller deployments | Costs increase as more users gain access |
| MAU Pricing | Active users | Monthly engagement | SaaS applications with variable usage | Monthly costs may fluctuate |
| Capacity-Based Pricing | Platform resources and workloads | Processing and usage requirements | Large-scale customer-facing analytics | Requires capacity planning |
| Application-Based Pricing | Licensed applications | Minimal impact from user growth | Organizations expecting rapid adoption | May pay ahead of need in early stages |
The most important difference between these models is the metric that drives future costs. Before choosing a platform, organizations should understand how pricing behaves when analytics adoption expands from hundreds to thousands of users.
How popular embedded analytics vendors structure their pricing
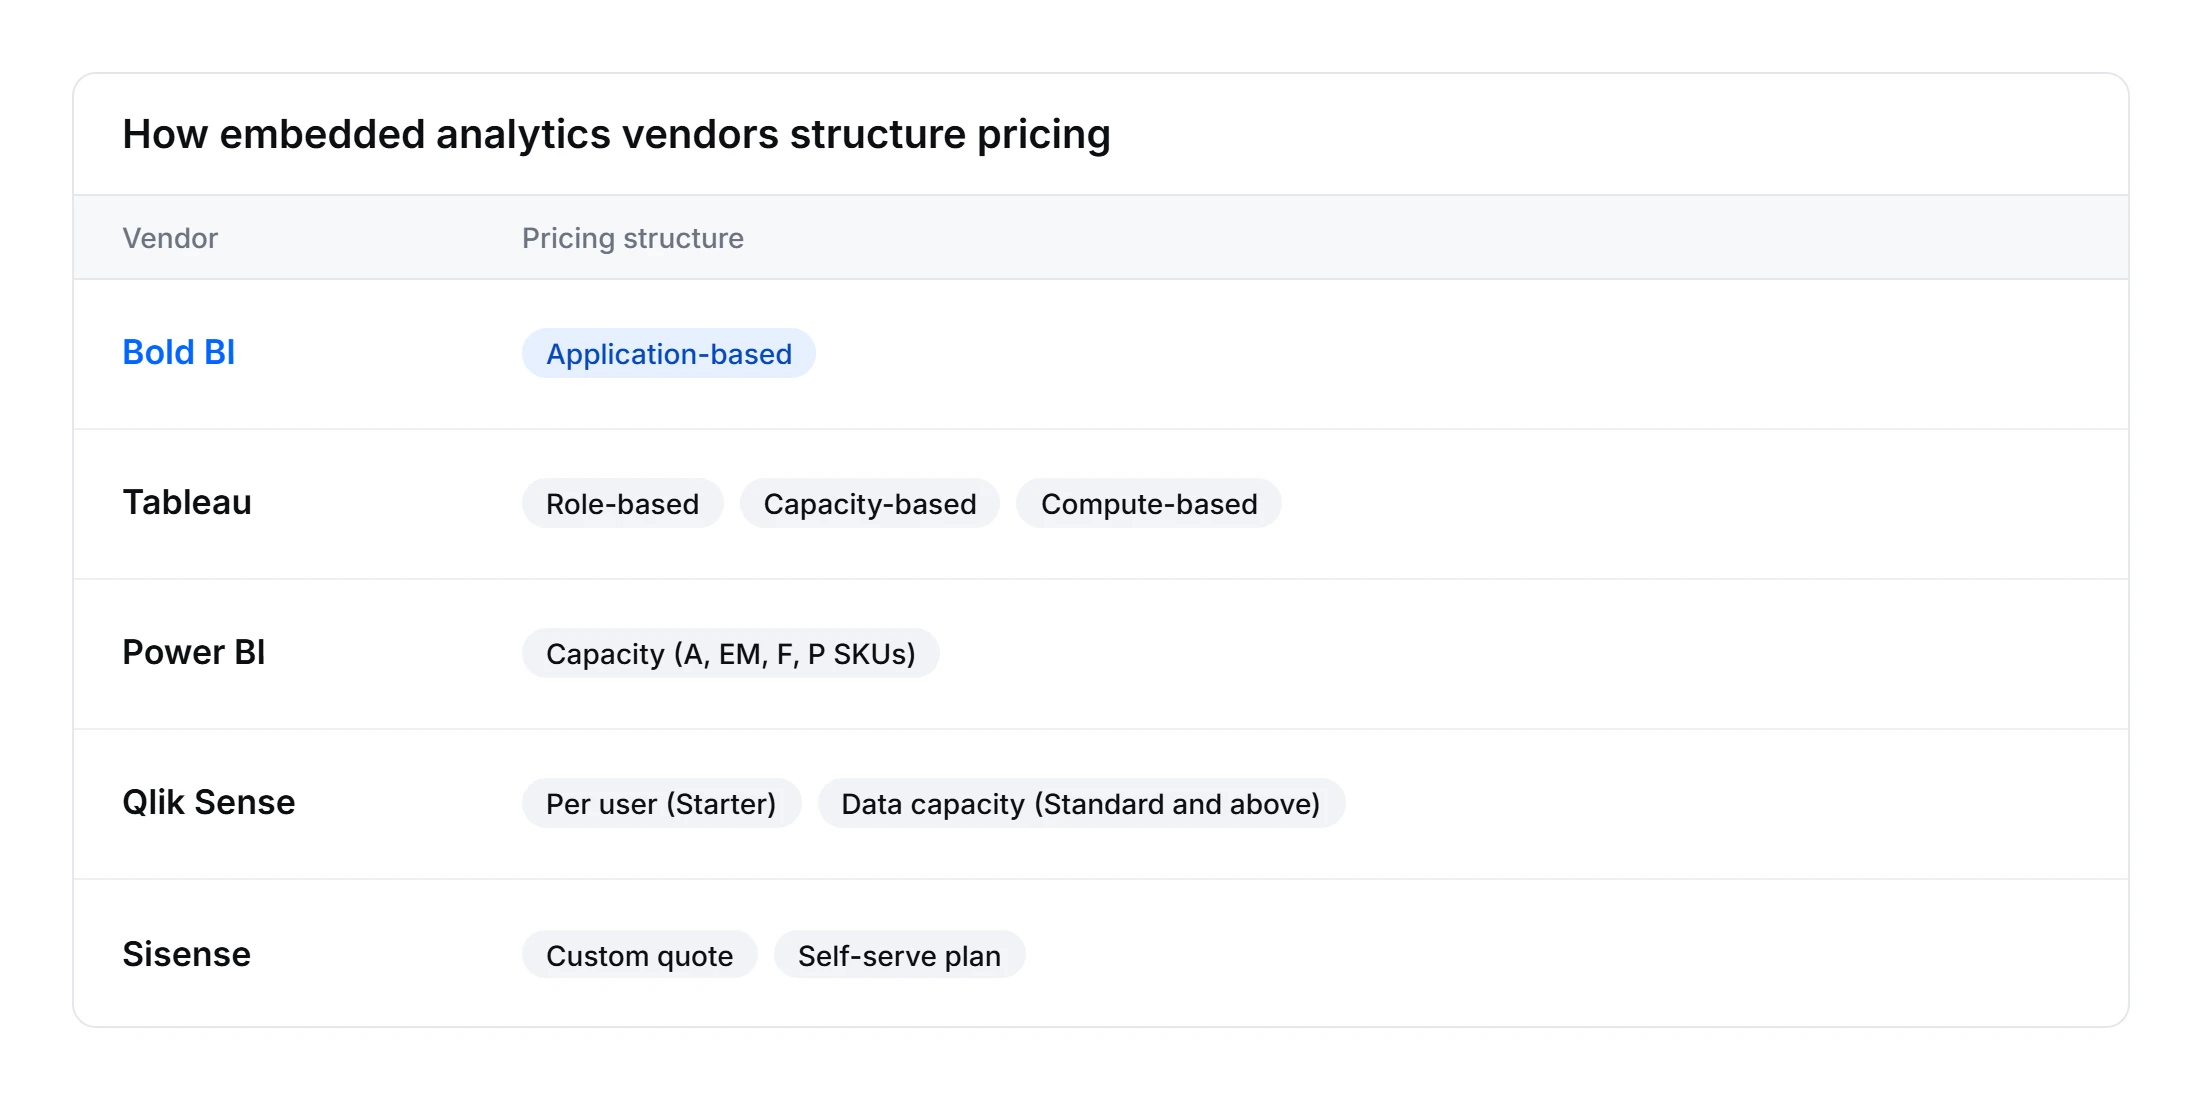
Most embedded analytics vendors use similar pricing concepts, but apply them differently. The examples below are based on publicly available information as of October 2026 and may change over time.
- Bold BI: Uses application-based licensing, with pricing based on application and deployment requirements rather than per-user or per-viewer fees.
- Tableau: Tableau offers three licensing models for embedded analytics: role-based licensing (Creator, Explorer, and Viewer) for Tableau Cloud and Tableau Server, usage-based licensing for Tableau Cloud, measured in analytical impressions when external viewers access embedded content, and core-based licensing for Tableau Server.
- Power BI: For embedding analytics in customer-facing applications, Power BI is priced by capacity rather than per user. Organizations purchase capacity through A, EM, or Microsoft Fabric F SKUs. Microsoft is retiring Premium P SKUs in favor of F SKUs. When embedding analytics for your customers, end users do not require a Power BI license. Report authors and publishers typically require a Power BI Pro or Premium Per User (PPU) license.
- Qlik Sense: Qlik offers Qlik Sense in the cloud through its Qlik Cloud Analytics plans. The entry-level Starter plan includes a set number of users, while the Standard plan and above are priced by data capacity. Standard starts at $825 per month for 25 GB of data, billed annually. These are Qlik Cloud Analytics plans rather than embedded-specific pricing, so confirm embedding terms with Qlik. Qlik Sense Enterprise Client-Managed, the self-hosted version, isn’t priced on that page.
- Sisense: Sisense primarily offers custom pricing that varies by deployment, architecture, scale, and business requirements. Sisense offers a self-serve plan, while enterprise pricing is provided through a custom quote based on deployment requirements.
Because pricing models, packaging, and licensing terms can change over time, verify current information directly with vendors during your evaluation process.
How do embedded analytics costs change as you scale?
Pricing models often appear similar during early deployments. The differences become much more noticeable as adoption increases.
The example below uses illustrative pricing only and does not represent any vendor’s actual pricing.
Illustrative assumptions used below:
- Per-user pricing: $10 per user/month
- MAU pricing: $5 per monthly active user, with 40% active usage
- Capacity-based pricing: starts at $1,000/month and increases as additional capacity is required
- Flat or application-based pricing: hypothetical fixed cost of $2,500/month
Note: Application-based pricing quotes can still vary based on deployment type and scale tier requirements. The key difference is that pricing isn’t tied directly to individual user seats or viewer counts.
| Monthly Cost | 500 Users | 5,000 Users | 50,000 Users |
| Per-User Pricing | $5,000 | $50,000 | $500,000 |
| MAU Pricing (40% active users) | $1,000 | $10,000 | $100,000 |
| Capacity-Based Pricing | $1,000 | $4,000 | $12,000 |
| Application-Based Pricing (illustrative example only; actual pricing varies by deployment requirements and scale tiers) | $2,500 | $2,500 | $2,500 |
Three important patterns emerge:
- User-based pricing typically increases alongside customer growth.
- Usage-based pricing can reduce costs during early adoption but still scales with engagement.
- Capacity-based and application-based pricing often provide more predictable long-term costs.
Capacity-based and application-based pricing are not the same
While both models can remain cost-effective at high user volumes, they scale differently. With capacity-based pricing, costs are tied to platform resources and workloads. As usage increases, you may need to purchase additional capacity, move to higher tiers, or actively monitor utilization to maintain performance.
Application-based pricing focuses on the application rather than user counts or platform consumption. As a result, organizations can often expand analytics adoption without forecasting per-user licenses or usage credits. For businesses expecting significant customer growth, this difference can make long-term budgeting and cost forecasting easier.
Hidden costs that can affect embedded analytics pricing
Licensing is only one part of the total investment required for embedded analytics. Before comparing vendors, consider expenses that may not appear in the initial quote.
- Viewer licenses: Some vendors charge separately for dashboard viewers and creators.
- Overage charges: Additional fees may apply when usage exceeds contracted limits.
- Development and staging environments: Non-production environments may require separate licensing.
- Capacity upgrades: Increased demand may require moving to higher capacity tiers.
- Infrastructure expenses: Self-hosted and private-cloud deployments can introduce hosting and operational costs.
- White-labeling capabilities: Branding customization may not always be included in base pricing.
- Multi-tenancy support: Some vendors treat tenant isolation and management features as premium capabilities.
Evaluating these costs alongside licensing fees provides a more accurate understanding of total ownership costs.
Which embedded analytics pricing model is right for your business?
The best pricing model depends on your deployment strategy, growth expectations, and budgeting priorities.
| If your priority is | Recommended pricing model |
| Keeping licensing simple | Per-user pricing |
| Paying only for active users | MAU pricing |
| Supporting large customer populations | Capacity-based pricing |
| Delivering analytics to every customer without user-based licensing | Application-based pricing |
Rather than choosing based solely on today’s requirements, evaluate which pricing model can continue supporting your organization as analytics adoption expands.
Questions to ask embedded analytics vendors before you buy
Before signing a contract, ask vendors the following questions and understand how the answers could affect your long-term costs.
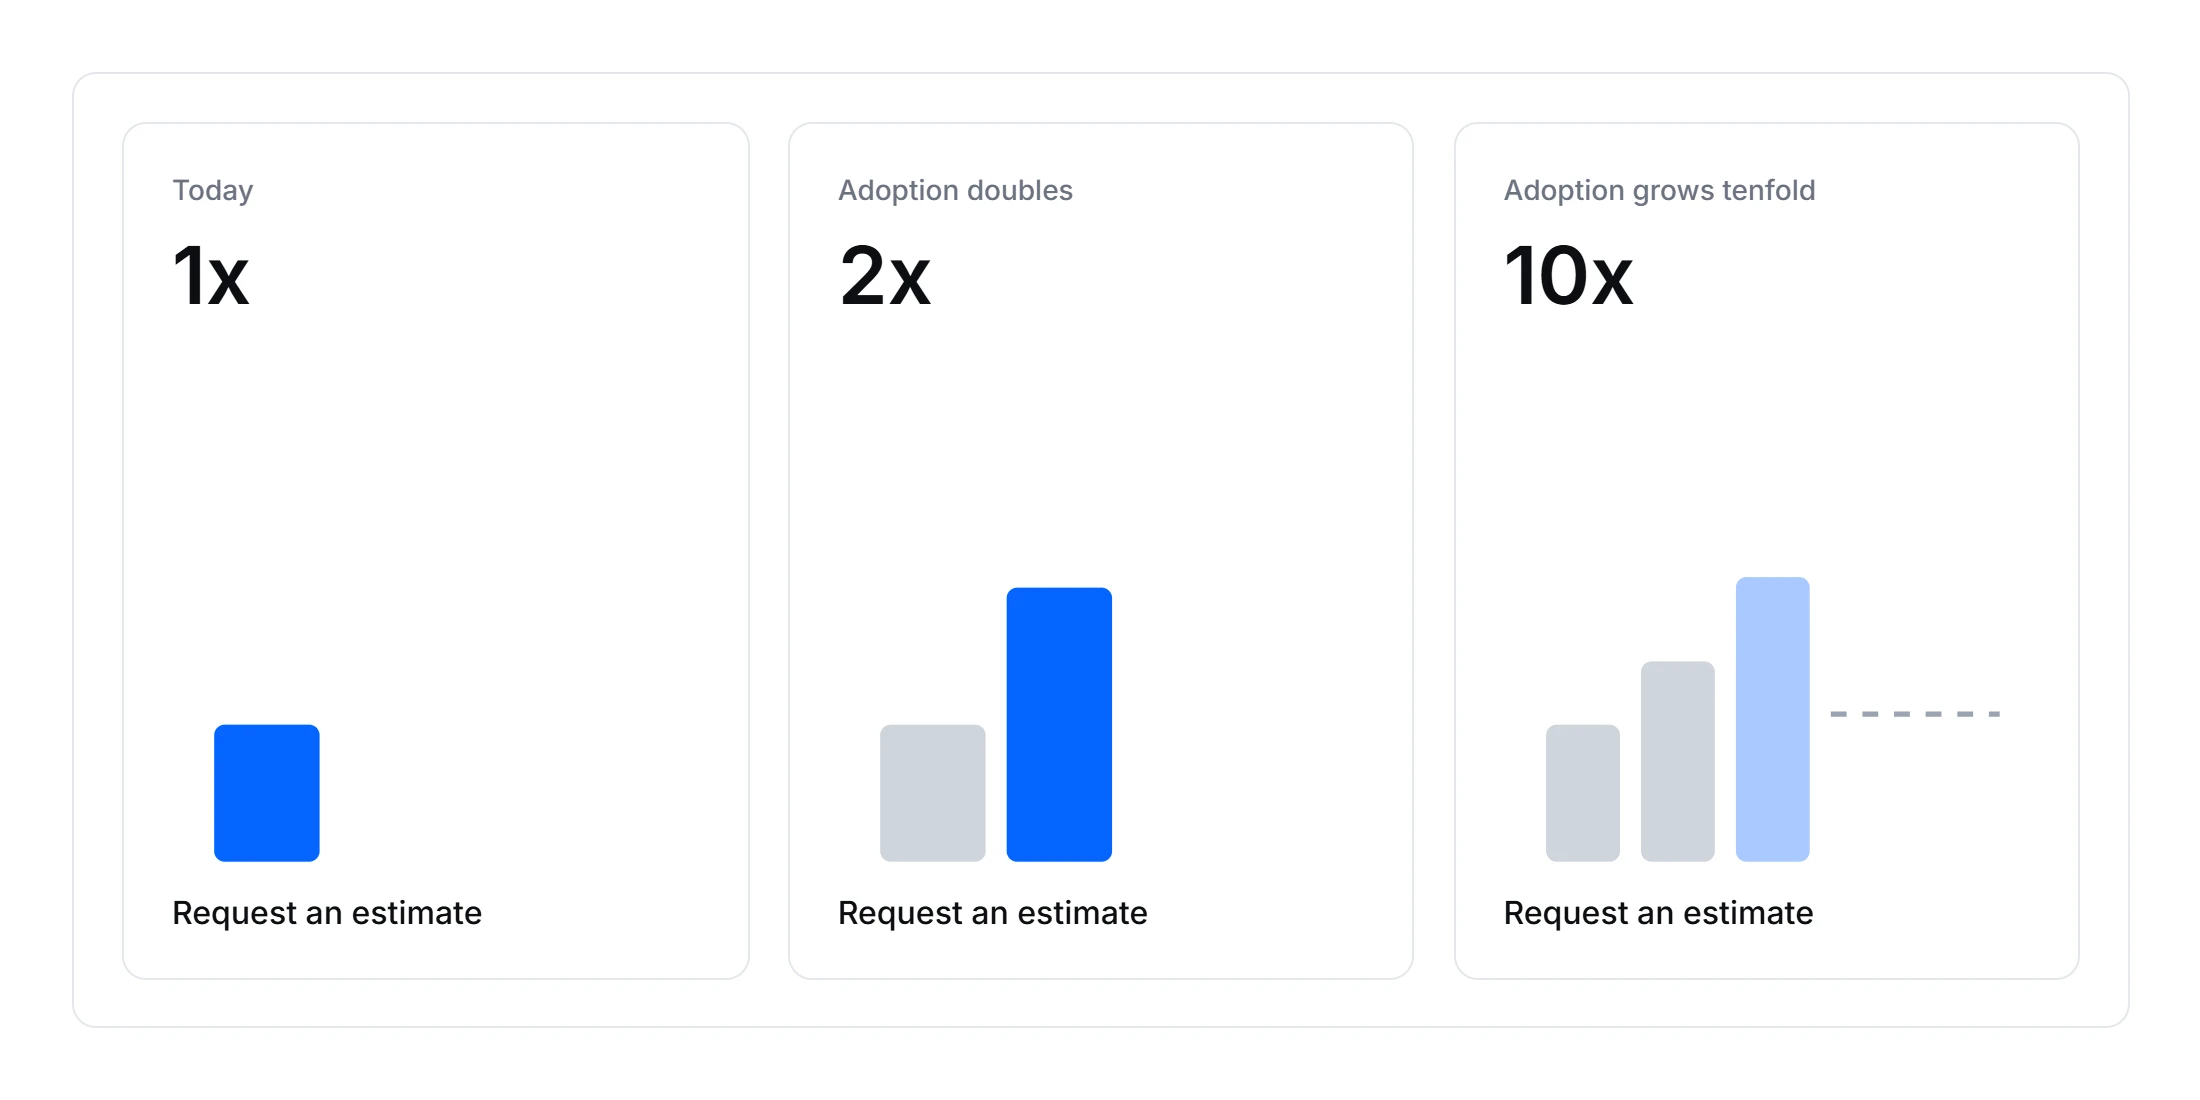
How does pricing change if user adoption doubles or grows tenfold?
A pricing model that seems affordable at first may become significantly more expensive as adoption grows. Request pricing estimates at multiple growth stages to understand how costs scale over time.
What metric drives future pricing: users, activity, capacity, or deployments?
Understanding what triggers pricing increases helps determine whether costs align with your growth strategy or rise simply because more customers access analytics.
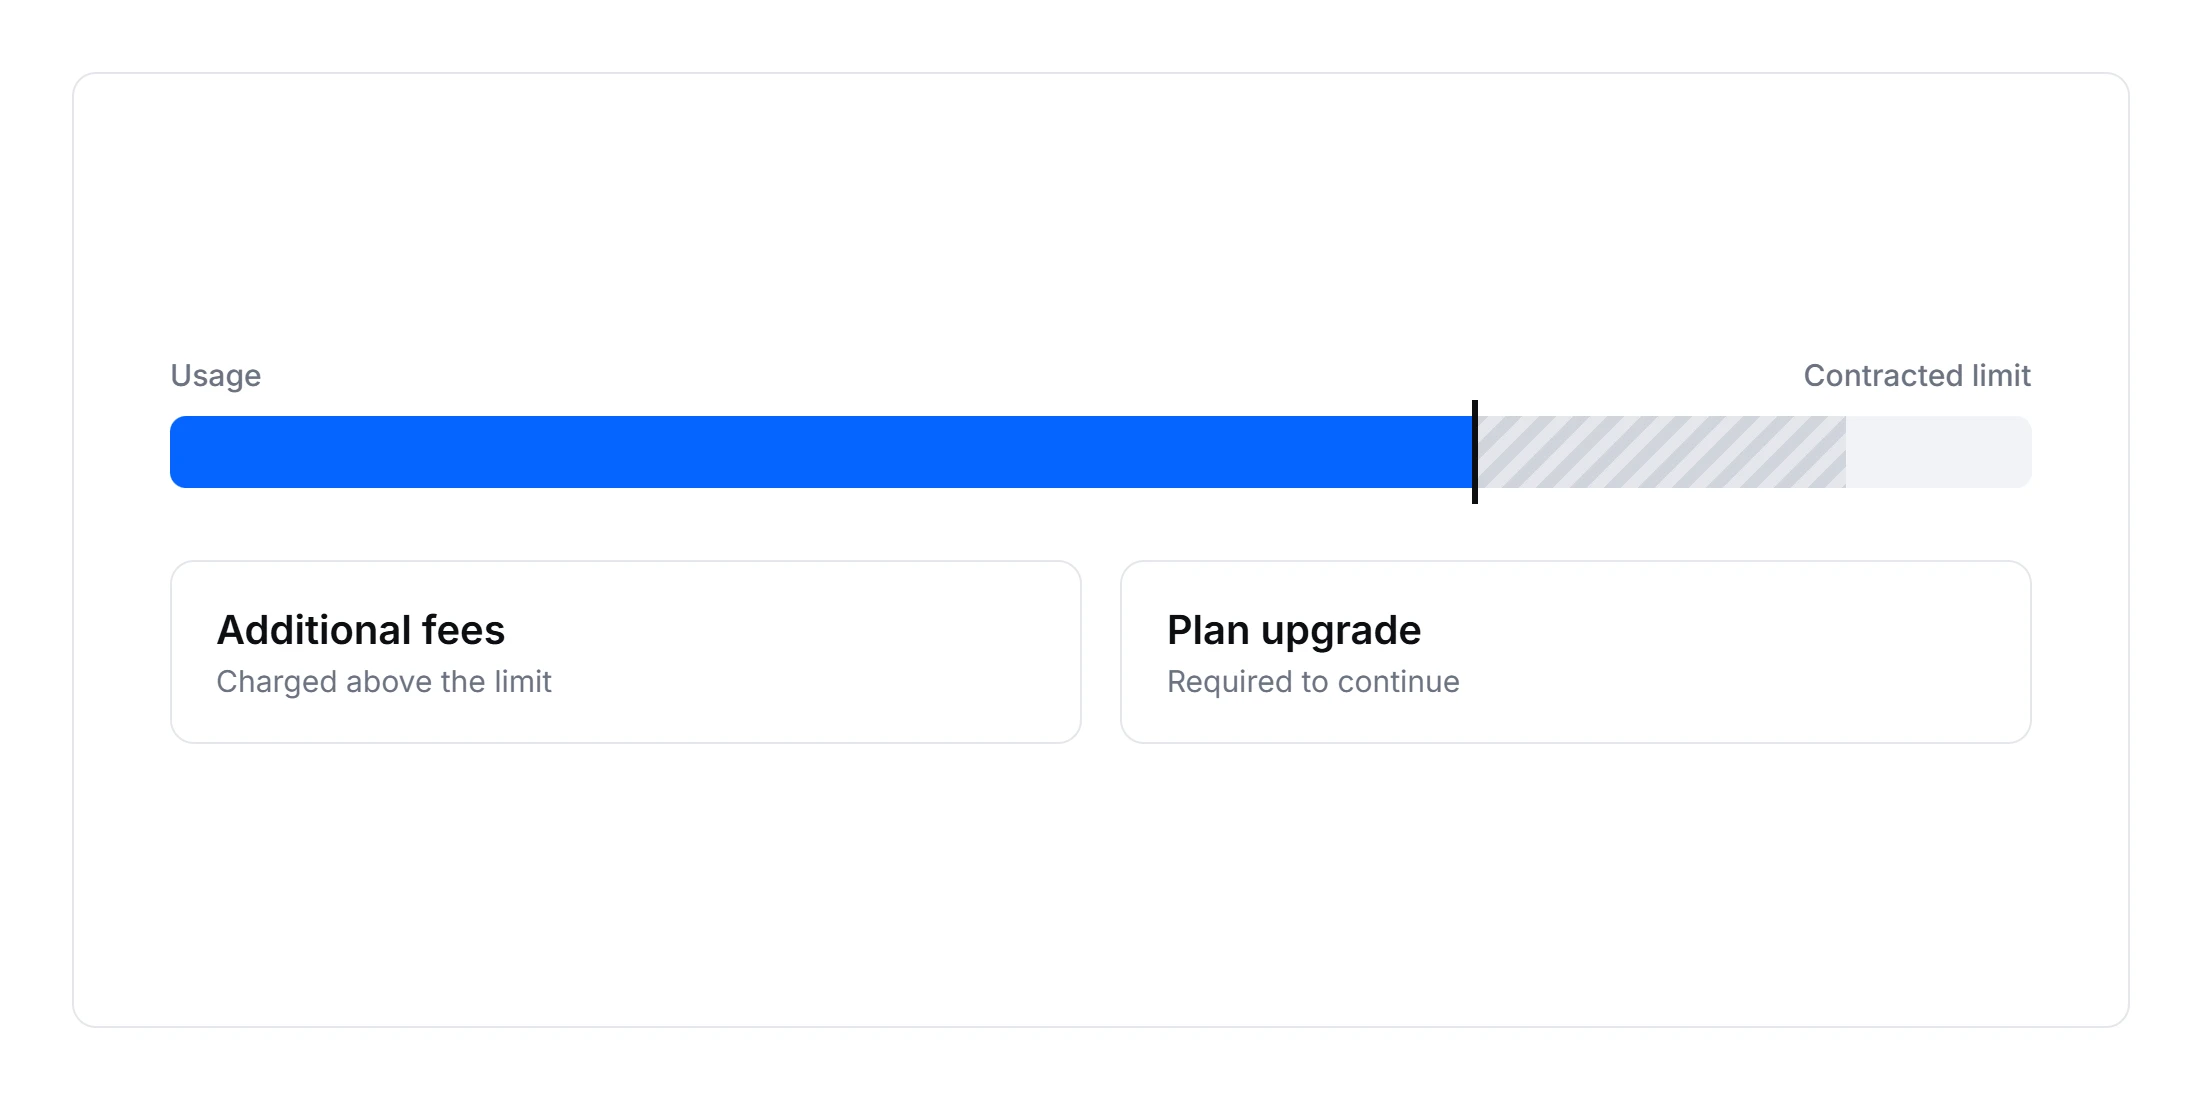
How are overages handled if usage exceeds contracted limits?
Some vendors apply additional fees, while others require plan upgrades. Clarifying this upfront can help prevent unexpected charges later.
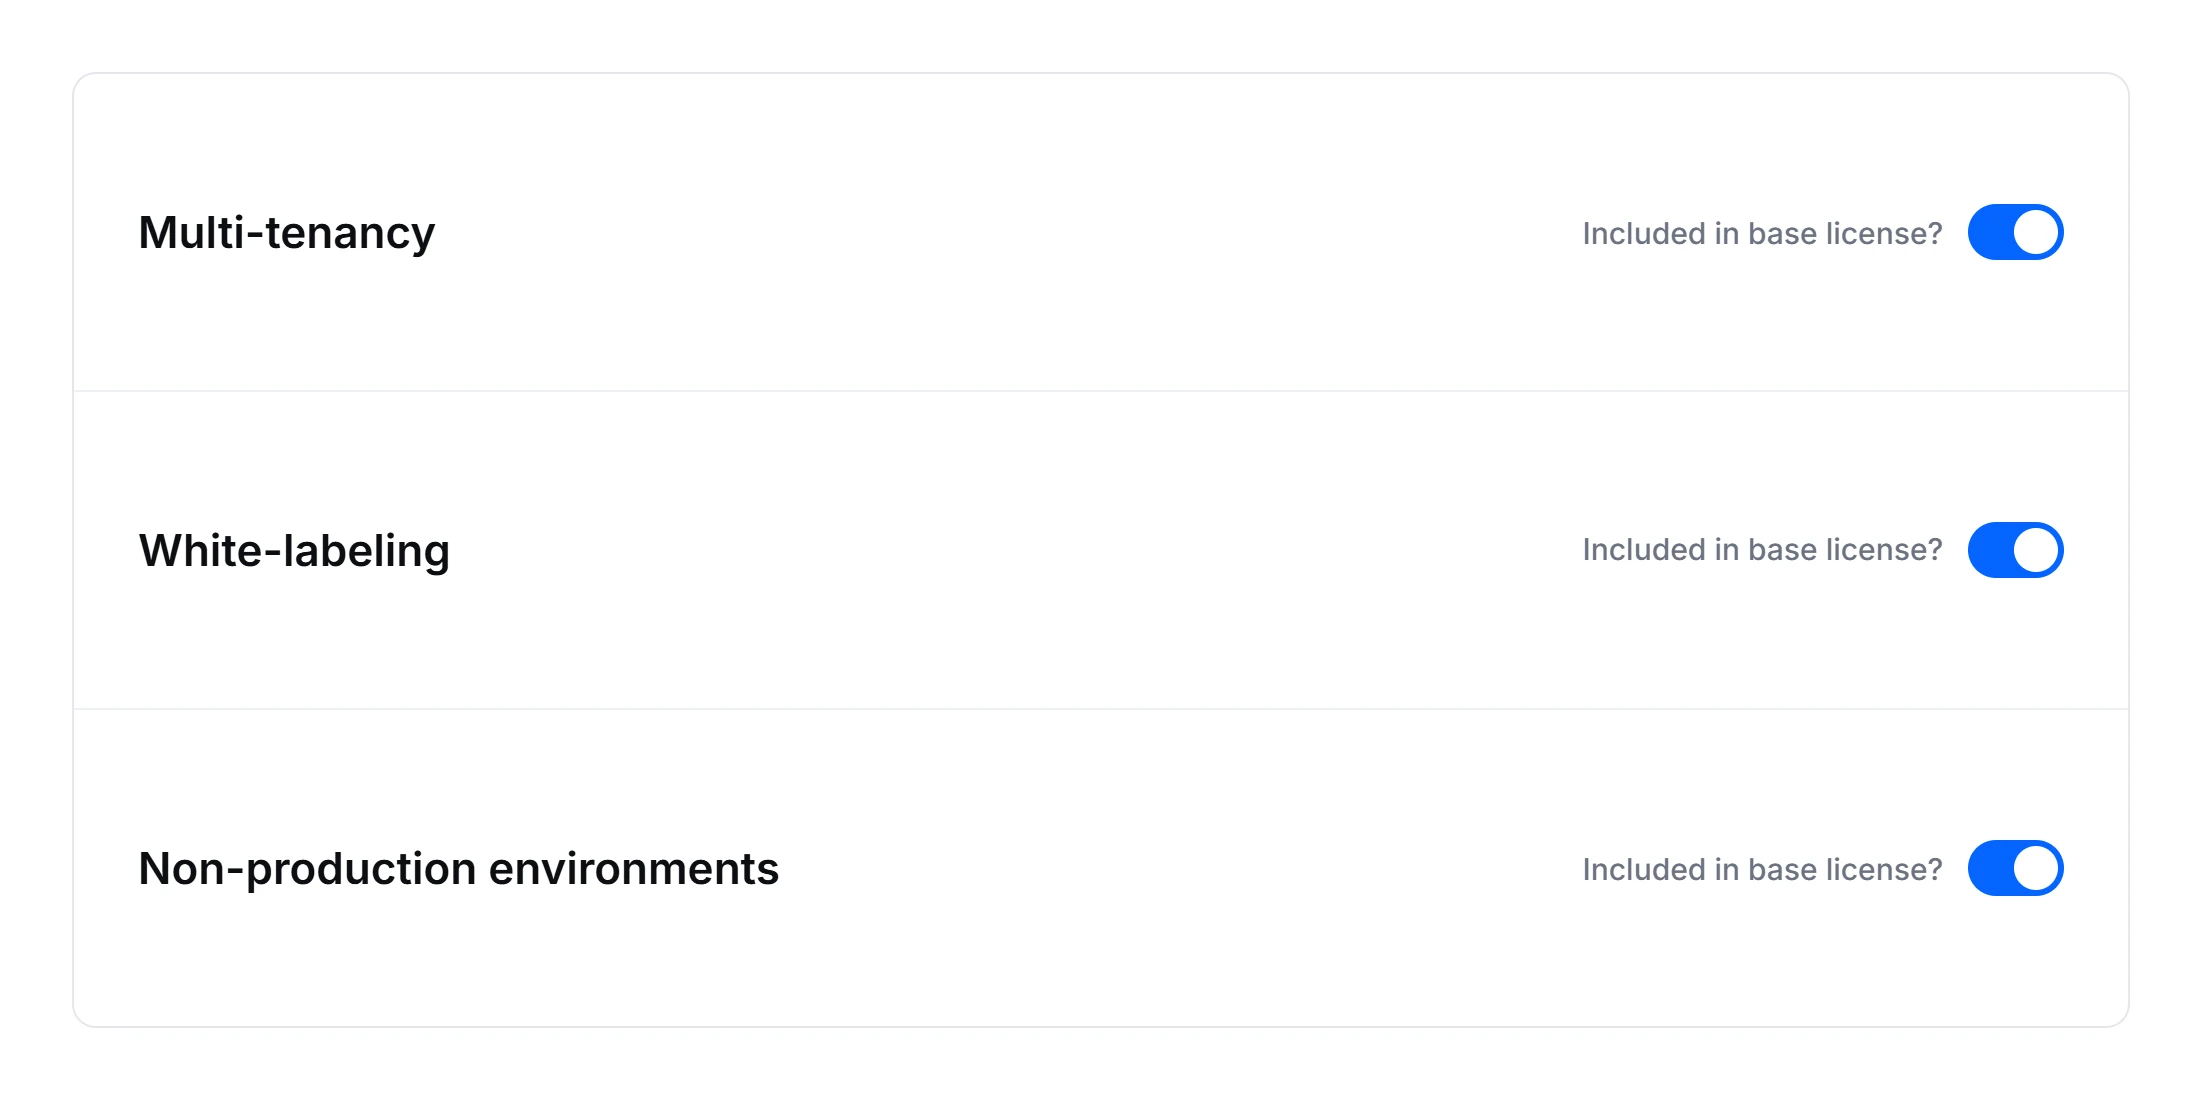
Do you include multi-tenancy, white-labeling, and non-production environments?
These capabilities are often essential for embedded analytics deployments, but the base license may not include them.
Does pricing change based on deployment model or infrastructure requirements?
Cloud, managed private cloud, and self-hosted deployments can carry different cost implications. Understanding these differences helps organizations plan more effectively. The answers can reveal limitations and costs that may not be obvious during an initial vendor evaluation.
Why organizations choose Bold BI for predictable embedded analytics pricing
Organizations embedding analytics into customer-facing applications often look for pricing models that do not increase every time a new customer accesses a dashboard. Bold BI uses an application-based licensing approach rather than charging per user or per viewer. This allows organizations to expand analytics adoption without managing per-user or per-viewer licensing fees.
When evaluating embedded analytics pricing, several Bold BI characteristics are especially relevant:
- No per-user licensing fees: Customer growth does not automatically require additional user licenses.
- No per-viewer licensing fees: Organizations can expand dashboard access without managing viewer-based costs.
- Licensed by application: Pricing is based on the application and deployment requirements rather than individual seat counts.
- Embedding included: Embedding analytics capabilities are included as part of the platform.
- Multi-tenancy support: Designed to support SaaS and customer-facing analytics deployments.
- Consistent capabilities across editions: Cloud, Managed Private Cloud, and On-Premises deployments include the same core feature set.
One consideration is that Bold BI does not publish a fixed public price list. Organizations typically request a customized quote based on deployment type and scale tier requirements.
However, application-based pricing isn’t necessarily the lowest-cost option in every scenario. Organizations supporting a small internal audience with no plans to embed analytics externally may find a traditional per-user model has a lower initial cost. The best pricing model depends on how you’ll deploy analytics and how adoption is expected to grow.
How to build an embedded analytics pricing strategy that scales
The right embedded analytics pricing model should support growth without creating licensing complexity as adoption increases.
When evaluating vendors, compare pricing at multiple growth stages, understand what drives future cost increases, and account for potential hidden expenses. Looking beyond the initial subscription cost helps create a more accurate picture of long-term value.
For organizations embedding analytics into customer-facing applications, Bold BI® offers application-based licensing that avoids per-user and per-viewer fees while making it easier to forecast analytics costs as adoption grows. Whether you’re evaluating embedded analytics for a SaaS platform, customer portal, or partner application, Bold BI provides flexible deployment options and scalable analytics capabilities designed for long-term growth.
Ready to see how scalable embedded analytics pricing could work for your application? Start a free trial of Bold BI or request a personalized demo to explore the best pricing approach for your growth strategy.
Frequently asked questions
-
-
-
- 1.
Does Bold BI charge per user?
No. According to Bold BI’s pricing page, there is no per-user or per-viewer fee. Quotes are based on deployment type and scale requirements.
- 2.
How do I estimate embedded analytics costs?
Evaluate pricing at multiple growth stages, estimate expected adoption levels, consider deployment requirements, and account for additional expenses such as infrastructure, staging environments, and overage charges.
- 3.
Is MAU pricing cheaper than per-user pricing?
It can be when only a portion of users actively access analytics each month. However, costs can still increase significantly as engagement and adoption grow.
- 4.
What is the most common embedded analytics pricing model?
There is no single standard. Per-user and role-based licensing remains widespread for internal BI, while embedded analytics offerings increasingly use capacity-based, usage-based, or application-based models. Compare vendors on what drives future costs rather than on which model is most common.
- 5.
Does Bold BI include embedded analytics capabilities?
Yes. Embedded analytics capabilities are included as part of the Bold BI platform and do not require a separate embedding product.
- 6.
Can Bold BI be deployed on-premises or in private cloud environments?
Yes. Bold BI supports cloud, managed private cloud, and on-premises deployments while maintaining the same core feature set across editions.
- 1.
-
-





