

Improve Dashboard Performance by Optimizing Data Access

Business dashboards provide visualizations of business data to communicate metrics and other key points to users at a glance. Such a dashboard should respond quickly to any dynamic user interaction. The loading performance of a dashboard not only affects the dashboard objects’ rendering but also the connected database’s querying performance. In this article, let’s explore how SQL Server database columnar storage and indexing help to load dashboards much faster.
Setting up SQL Server database with sample data set and recordings
Take a sample data set of over 25 million records. For this example, we downloaded the UK HM Land Registry Price paid data set from this government site. Then move the data from the CSV file to a SQL Server database running in a local machine with 16 GB RAM.
Executing a simple count statement, it takes one minute and seven seconds for the first run to complete query execution. The second run takes only two seconds since it utilizes the SQL Server default caching operations of previous query results.
| Query | 1st run | 2nd run |
| Select Count([UID]) FROM [TestDataBase].[dbo].[HMLandRegistryPPDIndex1] | 1 minute 7 seconds | 2 seconds |
Note: I have used SQL Server Management Studio to run these queries and get these metrics.
Here are two more sample queries with recordings for testing purposes during both runs.
| Query | 1st run | 2nd run |
| select top 10 [Date], Sum(Cast([Price] as decimal)) from [TestDataBase].[dbo].[HMLandRegistryPPDIndex1] group by [Date] Order by [Date] |
1 minute 41 seconds | 13 seconds |
| SELECT SUM (CAST ([33d9f9e75941f5925a87298f8894d9].[Price] AS DECIMAL (38,0))) AS [column1]FROM [TestDataBase].[dbo].[HMLandRegistryPricePaidData] AS [33d9f9e75941f5925a87298f8894d9] |
3 minutes 32 seconds | 9 seconds |
Actions for improved performance
As a business user, we expect our business dashboards to load in seconds. So, to speed up data access and aggregation, perform the following two actions:
- Convert the row store to columnar store. This will give high performance gains for analytic queries that require scanning large amounts of data. Execute the following command to created clustered columnar store.
| CREATE CLUSTERED COLUMNSTORE INDEX PPDClusteredColumnarIndex ON [HMLandRegistryPPDIndex1]; |
To learn more about column store in SQL Server, refer to this Microsoft documentation.
2. Starting with SQL Server 2016, you can combine row store index and column store index on the same table. Create a nonclustered row index on the same table using the following command. This row index will improve table seek performance, so queries that look for matching values or return a range of values will perform better in row index than columnar index.
| CREATE INDEX PricePaidRowIndex ON dbo.[HMLandRegistryPPDIndex1]([UID] , [Price] ,[Date], [Postcode], [PropertyType], [OldNew], [Duration], [PAON],[SAON], [Street], [Locality], [TownCity], [District], [County], [PPDCategoryType], [RecordStatus]) |
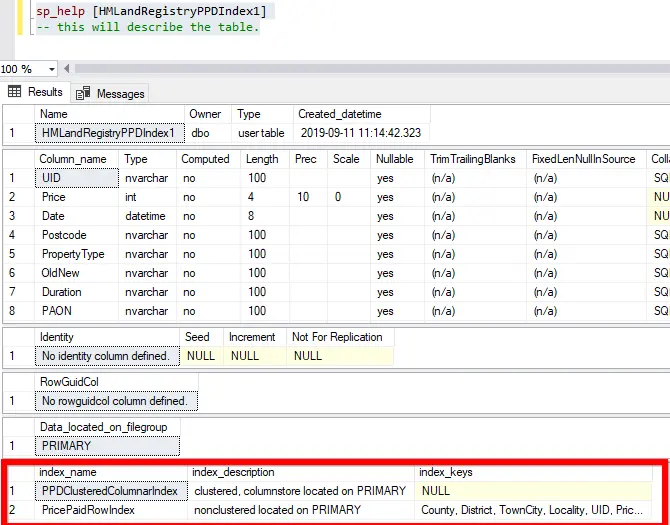
To verify whether the index has been created, try running the following command. This will describe the table details fully. At the bottom of the results, you can see that two indexes are present
| sp_help [HMLandRegistryPPDIndex1] |
Now let us rerun the sample queries to test the indexing performance.
| Queries | Before indexing | After indexing | ||
| 1st run | 2nd run | 1st run | 2nd run | |
| Select Count([UID]) FROM [TestDataBase].[dbo].[HMLandRegistryPPDIndex1] |
1 min 7 seconds | 2 seconds | 6 seconds | <1 second |
| select top 10 [Date], Sum(Cast([Price] as decimal)) from [TestDataBase].[dbo].[HMLandRegistryPPDIndex1] group by [Date] Order by [Date] |
1 min 41 seconds | 13 seconds | 3 seconds | <1 second |
| SELECT SUM (CAST ([33d9f9e75941f5925a87298f8894d9].[Price] AS DECIMAL (38,0))) AS [column1]FROM [TestDataBase].[dbo].[HMLandRegistryPricePaidData] AS [33d9f9e75941f5925a87298f8894d9] |
3 minutes 32 seconds | 9 seconds | <1 second | <1 second |
You can see that there is monumental improvement in SQL Query performance once columnar indexing and row indexing is done. To learn more about combining column and row indexing for data warehousing needs, refer to this documentation.
Creating a dashboard
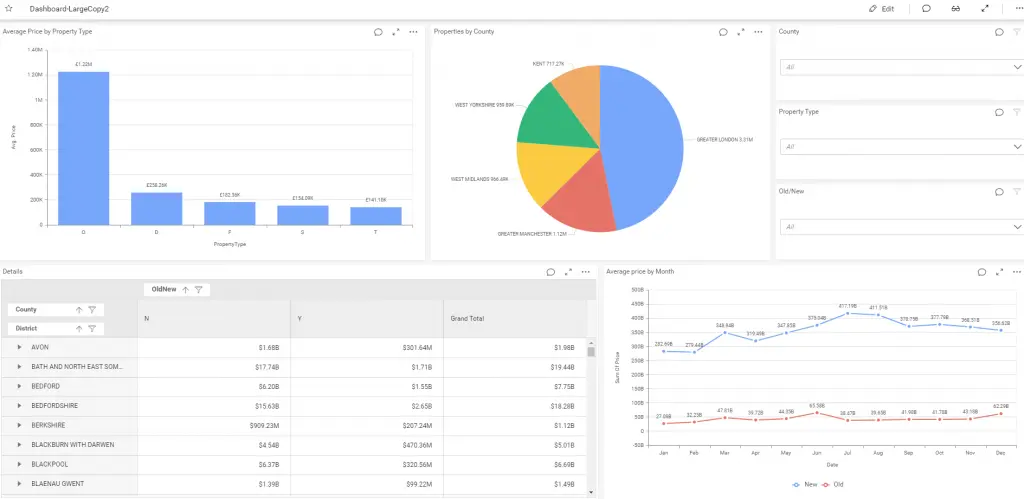
Now let’s build a dashboard connecting to this SQL Server database using Bold BI®. To learn about how to connect with SQL Server from Bold BI, read this blog post. Consider the following widgets and data configuration to prepare a dashboard on the HM Land Registry Price paid data set.
| Widget Title | Widget Type | Data Configuration |
| County | Combo Box | Column(s): County |
| Property Type | Combo Box | Column(s): PropertyType |
| Old/New | Combo Box | Column(s): OldNew |
| Average Price by Property Type | Column Chart | Value(s): PriceAggregation: AverageFormat:Type: CurrencyCurrency Culture: English (United Kingdom)Column: PropertyType |
| Details | Pivot Grid | Value(s): PriceAggregation: SumFormat:Type: CurrencyCurrency Culture: English (United Kingdom)Column(s): County and DistrictRow: OldNew |
| Average Price by Month | Line Chart | Value(s): PriceAggregation: SumFormat:Type: CurrencyCurrency Culture: English (United Kingdom)Column(s): DateFormat: MonthRow: OldNew |
| Properties Count by County | Pie Chart | Value(s): UIDAggregation: CountColumn(s): County |
Now the dashboard is ready.
Performance metrics
The average performance of this dashboard is given in the following.
| Processes | Average Timing (Seconds) |
| Query execution time in SQL Server | 15.26 |
| Dashboard rendering time | 9.56 |
| Total display time in dashboard | 24.82 |
To capture the query generated by Bold BI, use the SQL profiler trace option by connecting with the database server. Using the traced SQL queries for the previous dashboard, we have listed out the performance metrics for each of the queries before and after indexing separately for understanding.
| Widget Type – Title | After indexingDuration (seconds) | Before indexingDuration (seconds) |
| Drop-down – County | <1 second | 50 seconds |
| Drop-down – Property Type | < 1 second | 50 seconds |
| Drop-down – Old / New | < 1 second | 50 seconds |
| Column chart – Average Price by Property Type | 1 second | 1 minute 44 seconds |
| Pivot grid – Details | 2 seconds | 1 minute 2 seconds |
| Line chart – Average Price by Month | 4 seconds | 56 seconds |
| Pie chart – Properties by County | 6 seconds | 2 minutes 40 seconds |
| Total query execution time | ~16 seconds | ~8 minutes 52 seconds |
| Widget Type – Title | Query generated by BoldBI |
| Drop-down – County | SELECT TOP 101 [545123ceb74cbc808e056bafbbb13c].[County] AS [column1] FROM [dbo].[HMLandRegistryPPDIndex1] AS [545123ceb74cbc808e056bafbbb13c] GROUP BY [545123ceb74cbc808e056bafbbb13c].[County] ORDER BY [column1] ASC |
| Drop-down – Property Type | SELECT TOP 101 [545123ceb74cbc808e056bafbbb13c].[PropertyType] AS [column1] FROM [dbo].[HMLandRegistryPPDIndex1] AS [545123ceb74cbc808e056bafbbb13c] GROUP BY [545123ceb74cbc808e056bafbbb13c].[PropertyType] ORDER BY [column1] ASC |
| Drop-down – Old New | SELECT TOP 101 [545123ceb74cbc808e056bafbbb13c].[OldNew] AS [column1] FROM [dbo].[HMLandRegistryPPDIndex1] AS [545123ceb74cbc808e056bafbbb13c] GROUP BY [545123ceb74cbc808e056bafbbb13c].[OldNew] ORDER BY [column1] ASC |
| Column chart – Average Price by Property Type | SELECT TOP 51 [Custom_Sort_Order_Table].[column1] AS [column1] ,[Custom_Sort_Order_Table].[column2] AS [column2] FROM (SELECT [545123ceb74cbc808e056bafbbb13c].[PropertyType] AS [column1], AVG (CAST ([545123ceb74cbc808e056bafbbb13c].[Price] AS DECIMAL (38,0))) AS [column2] FROM [dbo].[HMLandRegistryPPDIndex1] AS [545123ceb74cbc808e056bafbbb13c] GROUP BY [545123ceb74cbc808e056bafbbb13c].[PropertyType]) AS [Custom_Sort_Order_Table] INNER JOIN(SELECT [545123ceb74cbc808e056bafbbb13c].[PropertyType] AS [T_0_column1],AVG (CAST ([545123ceb74cbc808e056bafbbb13c].[Price] AS DECIMAL (38,0)))AS [T_0_545123ceb74cbc808e056bafbbb13c.Price] FROM [dbo].[HMLandRegistryPPDIndex1] AS [545123ceb74cbc808e056bafbbb13c] GROUP BY [545123ceb74cbc808e056bafbbb13c].[PropertyType]) AS [T_0] ON [Custom_Sort_Order_Table].[column1] = [T_0]. [T_0_column1] ORDER BY [T_0_545123ceb74cbc808e056bafbbb13c.Price] Desc |
| Pivot grid – Details | SELECT TOP 10001 [545123ceb74cbc808e056bafbbb13c].[OldNew] AS [column4], [545123ceb74cbc808e056bafbbb13c].[County] AS [column2], [545123ceb74cbc808e056bafbbb13c].[District] AS [column3], SUM (CAST ([545123ceb74cbc808e056bafbbb13c].[Price] AS DECIMAL (38,0))) AS [column1] FROM [dbo].[HMLandRegistryPPDIndex1] AS [545123ceb74cbc808e056bafbbb13c] GROUP BY [545123ceb74cbc808e056bafbbb13c].[OldNew], [545123ceb74cbc808e056bafbbb13c].[County], [545123ceb74cbc808e056bafbbb13c].[District] ORDER BY [column4] ASC, [column2] ASC, [column3] ASC |
| Line chart – Average Price by Month | SELECT TOP 101 MONTH([545123ceb74cbc808e056bafbbb13c].[Date]) AS [column2], [545123ceb74cbc808e056bafbbb13c].[OldNew] AS [column3], SUM (CAST ([545123ceb74cbc808e056bafbbb13c].[Price] AS DECIMAL (38,0))) AS [column1] FROM [dbo].[HMLandRegistryPPDIndex1] AS [545123ceb74cbc808e056bafbbb13c] GROUP BY MONTH([545123ceb74cbc808e056bafbbb13c].[Date]), [545123ceb74cbc808e056bafbbb13c].[OldNew] ORDER BY [column2] ASC |
| Pie chart – Properties by County | SELECT TOP 101 [Custom_Sort_Order_Table].[column2] AS [column2] ,[Custom_Sort_Order_Table].[column1] AS [column1] FROM (SELECT [545123ceb74cbc808e056bafbbb13c].[County] AS [column2], COUNT([545123ceb74cbc808e056bafbbb13c].[UID]) AS [column1] FROM [dbo].[HMLandRegistryPPDIndex1] AS [545123ceb74cbc808e056bafbbb13c] INNER JOIN (SELECT [545123ceb74cbc808e056bafbbb13c].[County] AS [County_0_0],ROW_NUMBER() OVER( ORDER BY COUNT([545123ceb74cbc808e056bafbbb13c].[UID]) DESC) AS [R:N_0] FROM [dbo].[HMLandRegistryPPDIndex1] AS [545123ceb74cbc808e056bafbbb13c] GROUP BY [545123ceb74cbc808e056bafbbb13c].[County]) [T_0] ON (([545123ceb74cbc808e056bafbbb13c].[County] = [T_0].[County_0_0] OR (([545123ceb74cbc808e056bafbbb13c].[County] IS NULL) AND ([T_0].[County_0_0] IS NULL))) AND ([T_0].[R:N_0] <= 5)) GROUP BY [545123ceb74cbc808e056bafbbb13c].[County]) AS [Custom_Sort_Order_Table] INNER JOIN(SELECT [545123ceb74cbc808e056bafbbb13c].[County] AS [T_0_column2],COUNT([545123ceb74cbc808e056bafbbb13c].[UID])AS [T_0_545123ceb74cbc808e056bafbbb13c.UID] FROM [dbo].[HMLandRegistryPPDIndex1] AS [545123ceb74cbc808e056bafbbb13c] INNER JOIN (SELECT [545123ceb74cbc808e056bafbbb13c].[County] AS [County_0_0],ROW_NUMBER() OVER( ORDER BY COUNT([545123ceb74cbc808e056bafbbb13c].[UID]) DESC) AS [R:N_0] FROM [dbo].[HMLandRegistryPPDIndex1] AS [545123ceb74cbc808e056bafbbb13c] GROUP BY [545123ceb74cbc808e056bafbbb13c].[County]) [T_0] ON (([545123ceb74cbc808e056bafbbb13c].[County] = [T_0].[County_0_0] OR (([545123ceb74cbc808e056bafbbb13c].[County] IS NULL) AND ([T_0].[County_0_0] IS NULL))) AND ([T_0].[R:N_0] <= 5)) GROUP BY [545123ceb74cbc808e056bafbbb13c].[County]) AS [T_0] ON [Custom_Sort_Order_Table].[column2] = [T_0]. [T_0_column2] ORDER BY [T_0_545123ceb74cbc808e056bafbbb13c.UID] Desc |
Conclusion
With this blog, we can conclude that for data warehousing, data analytics, and dashboarding use cases, we should leverage the indexing support provided by SQL Server in order to gain high performance on analytics queries running on large data. If you have any questions on this blog, please feel free to post them in the following comment section. Get started with Bold BI® by signing up for a free trial and create more interactive business intelligence dashboards. You can also contact us by submitting your questions through the Bold BI website or, if you already have an account, you can log in to submit your support question.





