

Manufacturing Dashboard Examples for Tracking Real‑Time KPIs

TL;DR: These manufacturing dashboard examples track KPIs like production cost trends. They show how to centralize production quality, inventory and maintenance data into a single, actionable view.
Introduction
Every minute of unexpected downtime impacts production schedules, delivery commitments and profitability. Yet many manufacturing teams still rely on disconnected spreadsheets or delayed reports to monitor performance. By the time an issue is identified, production may already be behind target.
These manufacturing dashboards show how operational data can be centralized into a single, real-time view. Instead of reacting after defects or delays occur, teams can monitor production efficiency, quality, inventory levels, and costs as they change.
This guide explores the best manufacturing dashboards, essential KPIs to track, and how analytics can improve operational efficiency across plants and production lines.
How manufacturing dashboards improve daily operations
A manufacturing dashboard streamlines operational oversight by combining production, equipment, quality, and cost data into one real-time visual platform. It helps by:
- Centralizing visibility into operations: Manufacturing dashboards unify all key performance indicators in one place, giving teams a clear overview of operations.
- Delivering real-time operational insights: By providing live updates on production metrics, dashboards enable quick responses and keep processes running smoothly.
- Controlling cost and efficiency: By enabling insights into resource use and waste, dashboards help cut costs and improve efficiency.
- Enabling trend-based decision making: Analyzing historical production and quality patterns improves planning, forecasting, and capacity management.
- Securing and scaling analytics: Offers role-based access and flexible deployment to protect data while supporting teams across the organization.
Key features to consider when visualizing manufacturing data
Not all dashboards deliver meaningful insight. To truly improve process control, a manufacturing dashboard should offer:
- Real-time data updates to track production metrics as they change.
- Alerts and notifications to flag downtime or quality issues immediately.
- Drill-down capabilities to analyze data by plant, line, shift, or machine.
- Role-based access so operators, supervisors, and executives see relevant KPIs.
- Clear visual layout with easy-to-interpret charts and performance indicators.
- Integration with production systems such as ERP, MES, quality systems, and databases.
Manufacturing dashboard examples to track real‑time KPIs
Bold BI® enables you to build robust, customizable manufacturing dashboards that monitor production metrics, visualize operational trends, and support data-driven decisions. The following are examples to inspire your own manufacturing dashboards.
Production monitoring dashboard
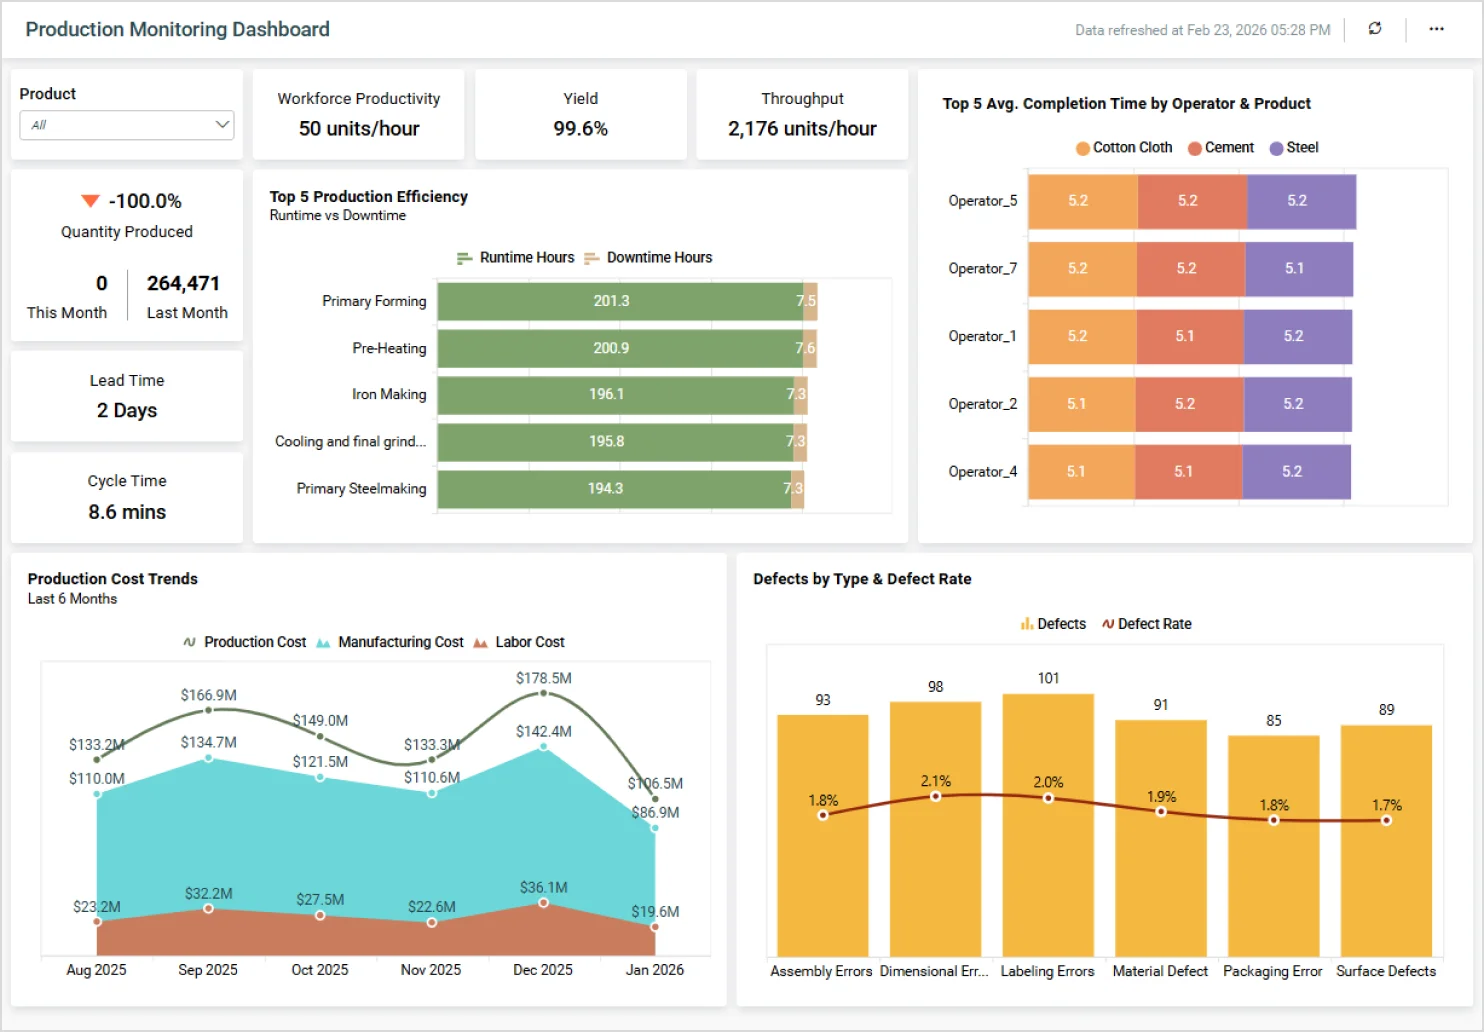
Manufacturers face limited real-time visibility, downtime, rising production costs, and difficulty spotting quality defects early. The Production Monitoring Dashboard addresses these problems by delivering real-time metrics and consolidating critical indicators into a single view. Teams can quickly identify bottlenecks, respond faster, and improve production performance.
Key metrics
- Top 5 production efficiency: Compares runtime and downtime for the most important production processes to show which operate smoothly and which lose time.
- Top 5 average completion time by operator & product: A heat map showing how long different operators take to complete tasks for each product. Use it to identify training needs.
- Production cost trends: Tracks monthly changes in total, manufacturing, and labor costs to reveal spending patterns and support better decisions.
- Defects by type and defect rate: Shows the number of defects by category and the defect rates to help improve overall product quality.
Distributor delivery performance dashboard
The Distributor Delivery Performance Dashboard gives a unified view of delivery speed, accuracy, on-time performance, customer satisfaction, and distributor reliability. It helps ensure efficient distribution and stronger customer relationships.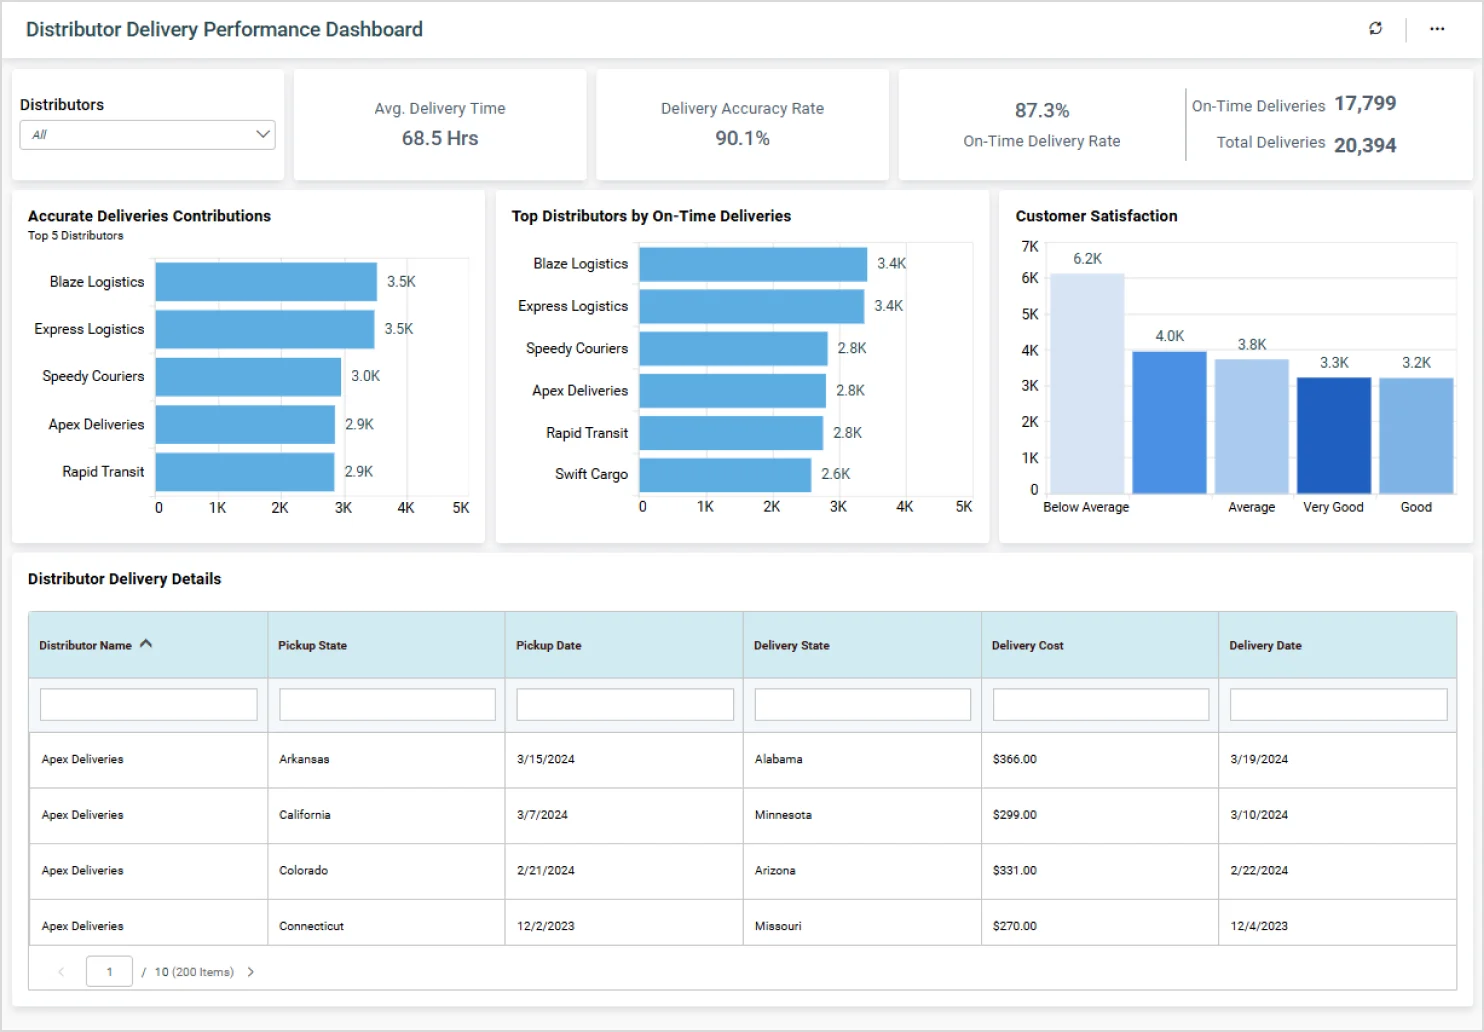
Key metrics
With this dashboard, you can monitor the following KPIs.
- Accurate delivery contributions: Shows how accurate each distributor is in their deliveries so you can focus on improvement efforts where accuracy issues are most common.
- Top distributors by on-time deliveries: Ranks distributors by consistency in meeting schedules to identify dependable partners.
- Customer satisfaction: Presents customer ratings across categories to evaluate delivery service quality and prioritize improvements.
- Distributor delivery details: A detailed table for drilling into individual delivery records. Use it for audits, timeline verification, and dispute resolution across distributors and routes.
The dashboards above were created through Bold BI to help manufacturers monitor production performance. If you’re planning to build your own version, a few design principles help. Follow the 10 Dashboard Design Best Practices for Insights to create dashboards that are clear, consistent, and actionable. If you’re new to dashboard creation, start with Creating a Dashboard in 5 Minutes or Less.
Additionally, you can enhance your understanding of BI in manufacturing through Transforming Manufacturing Processes with BI and learn how to embed analytical apps using Embedded Analytics for Manufacturing Industry.
Create your own manufacturing dashboard with Bold BI today
Bring all your production data together and track the KPIs that matter, like efficiency, cost, downtime, and quality, in one real-time view with a Bold BI® manufacturing dashboard.
Bold BI centralizes data from machine logs, quality systems, and spreadsheets into a single, customizable dashboard. This unified view delivers live metrics such as production efficiency and production cost trends.
Ready to enhance your manufacturing operations? Sign up for a free trial of Bold BI and start building interactive manufacturing dashboards instantly. Request a personalized demo to see how Bold BI fits your workflow. If you’re new to dashboards, explore our onboarding resources for step-by-step guidance.
Frequently asked questions
- 1.
Can Bold BI track real‑time manufacturing data?
Yes. Bold BI can refresh data frequently, enabling teams to view live production metrics and equipment performance as updates happen.
- 2.
Can we analyze performance by plant, line, or machine?
Yes. The dashboards support filtering and drill‑down so you can view data for specific plants, production lines, shifts, or individual machines.
- 3.
How does Bold BI help reduce equipment downtime?
Bold BI tracks downtime events, how long they last, and their root causes. This helps identify patterns so teams can prevent future downtime.
- 4.
Can we track long‑term costs and labor trends?
Yes. Bold BI lets you analyze labor and operational costs over months or years, which is useful for planning and budgeting.
- 5.
Is manufacturing data secure in Bold BI?
Yes. Bold BI uses enterprise‑level security features such as role‑based access, row‑level security, single sign‑on, and token authentication.
- 6.
Can dashboards be customized for different manufacturing roles?
Yes. You can tailor dashboards for operators, managers, quality teams, finance teams, and executives, ensuring each group sees the data most relevant to them.





