
Loan Performance Dashboard
Understand loan performance to manage risk and improve returns.
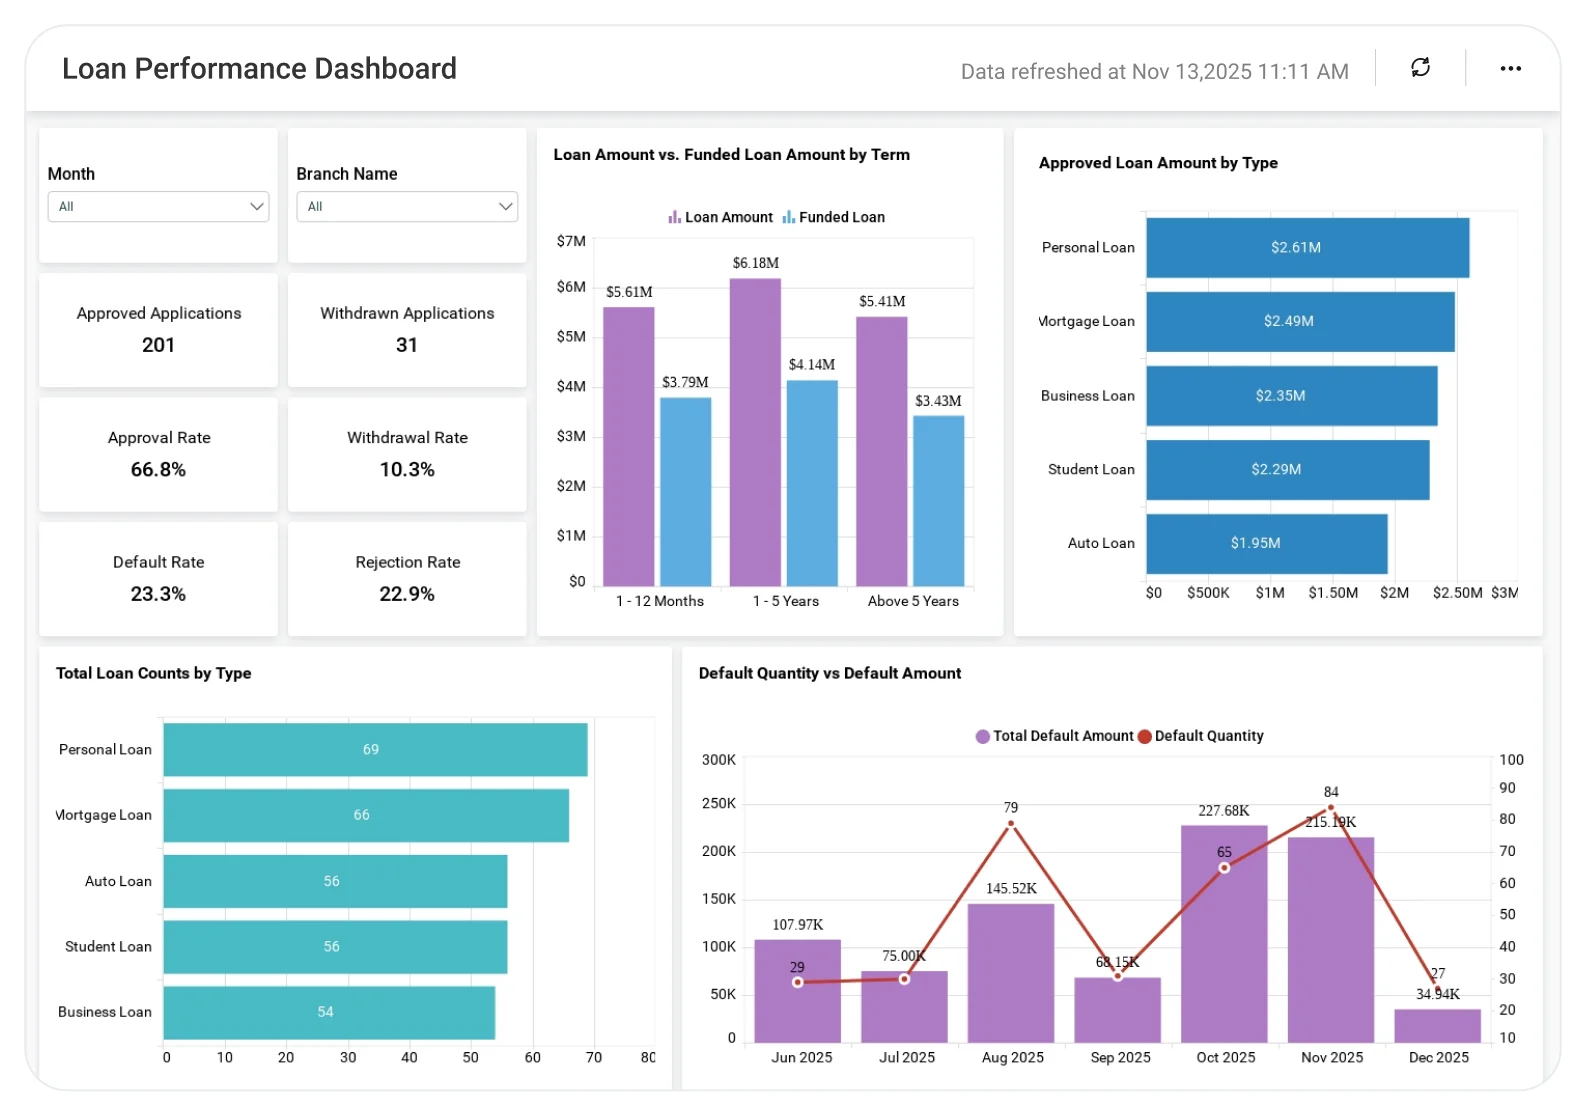
The Loan Performance Dashboard helps banking teams see loan disbursements, repayments, defaults, and overall loan trends, making it easier to control risk and make better lending decisions.
TL;DR
-
Track overall loan portfolio performance trends to understand portfolio health and exposure.
-
Monitor repayment behavior, delinquency, and default patterns to detect early credit risk.
-
Compare loan performance by product type and borrower segment to identify strengths and weaknesses.
-
Analyze regional and time-based risk indicators to uncover concentration and market risks.
-
Support smarter lending and credit decisions with data-driven loan performance insights.
What Is a Loan Performance Dashboard?
A Loan Performance Dashboard is an analytics solution that helps financial institutions evaluate how loans perform across their lifecycle, from disbursement to repayment or default.
In Bold BI, this dashboard consolidates loan systems, customer data, and repayment records to reveal trends, highlight risks, and support informed lending and portfolio management decisions.
Why Loan Performance Dashboard Matters
Loan portfolios directly impact profitability, liquidity, and regulatory compliance.
When loan data is reviewed across disconnected reports or spreadsheets:
-
Early warning signs of delinquency are missed.
-
Risk exposure is hard to quantify.
-
Portfolio performance lacks transparency.
-
Credit strategy becomes reactive.
A centralized analytics dashboard enables lenders to move from backward-looking reports to forward-looking, insight-driven loan management.
What You’ll Track
Using Bold BI dashboards, you will track important KPIs such as:
-
Loan portfolio distribution: Breakdown of loans by product type, status, and borrower segment to understand exposure.
-
Repayment performance trends: On-time payments, overdue amounts, and repayment behavior over time.
-
Delinquency & default metrics: Non-performing loans (NPL), delinquency rates, and default patterns to identify risk.
-
Segment & regional analysis: Loan performance by customer type, geography, or branch to detect concentration risks.
All dashboards are fully customizable, allowing you to add KPIs or metrics as needed.
How It Works
-
Apply the Loan Performance Dashboard sample.
-
Combine loan, customer, and repayment data in one unified view.
-
Analyze insights by loan type, borrower segment, region, or time period.
-
Share role-based dashboards with credit, risk, and leadership teams.
Why Bold BI Is the Right Fit for Loan Performance Analytics
-
Unified portfolio visibility: Bring loan, customer, and repayment data into a single analytics dashboard.
-
Centralized risk analysis: Evaluate performance, delinquency, and default trends together.
-
Comparative insights: Compare loan products, regions, or segments to identify strengths and weaknesses.
-
Actionable drilldowns: Investigate repayment issues, risk pockets, and portfolio shifts in detail.
-
Flexible deployment: Deploy dashboards in cloud or self-hosted environments to meet banking IT requirements.
Compare Options (at a glance)
| Feature | Bold BI | Core Banking Reports | Spreadsheets |
| Loan performance analytics | Yes | Limited | Manual |
| Delinquency & NPL insights | Yes | Partial | Manual |
| Segment & regional analysis | Yes | Limited | Manual |
| Actionable drilldowns | Yes | Limited | No |
| Custom KPIs & visuals | Fully customizable | Fixed | Manual |


