

Portfolio Risk Management Dashboard
Strengthen risk oversight, improve portfolio resilience, and support confident investment decisions with data‑driven risk insights.
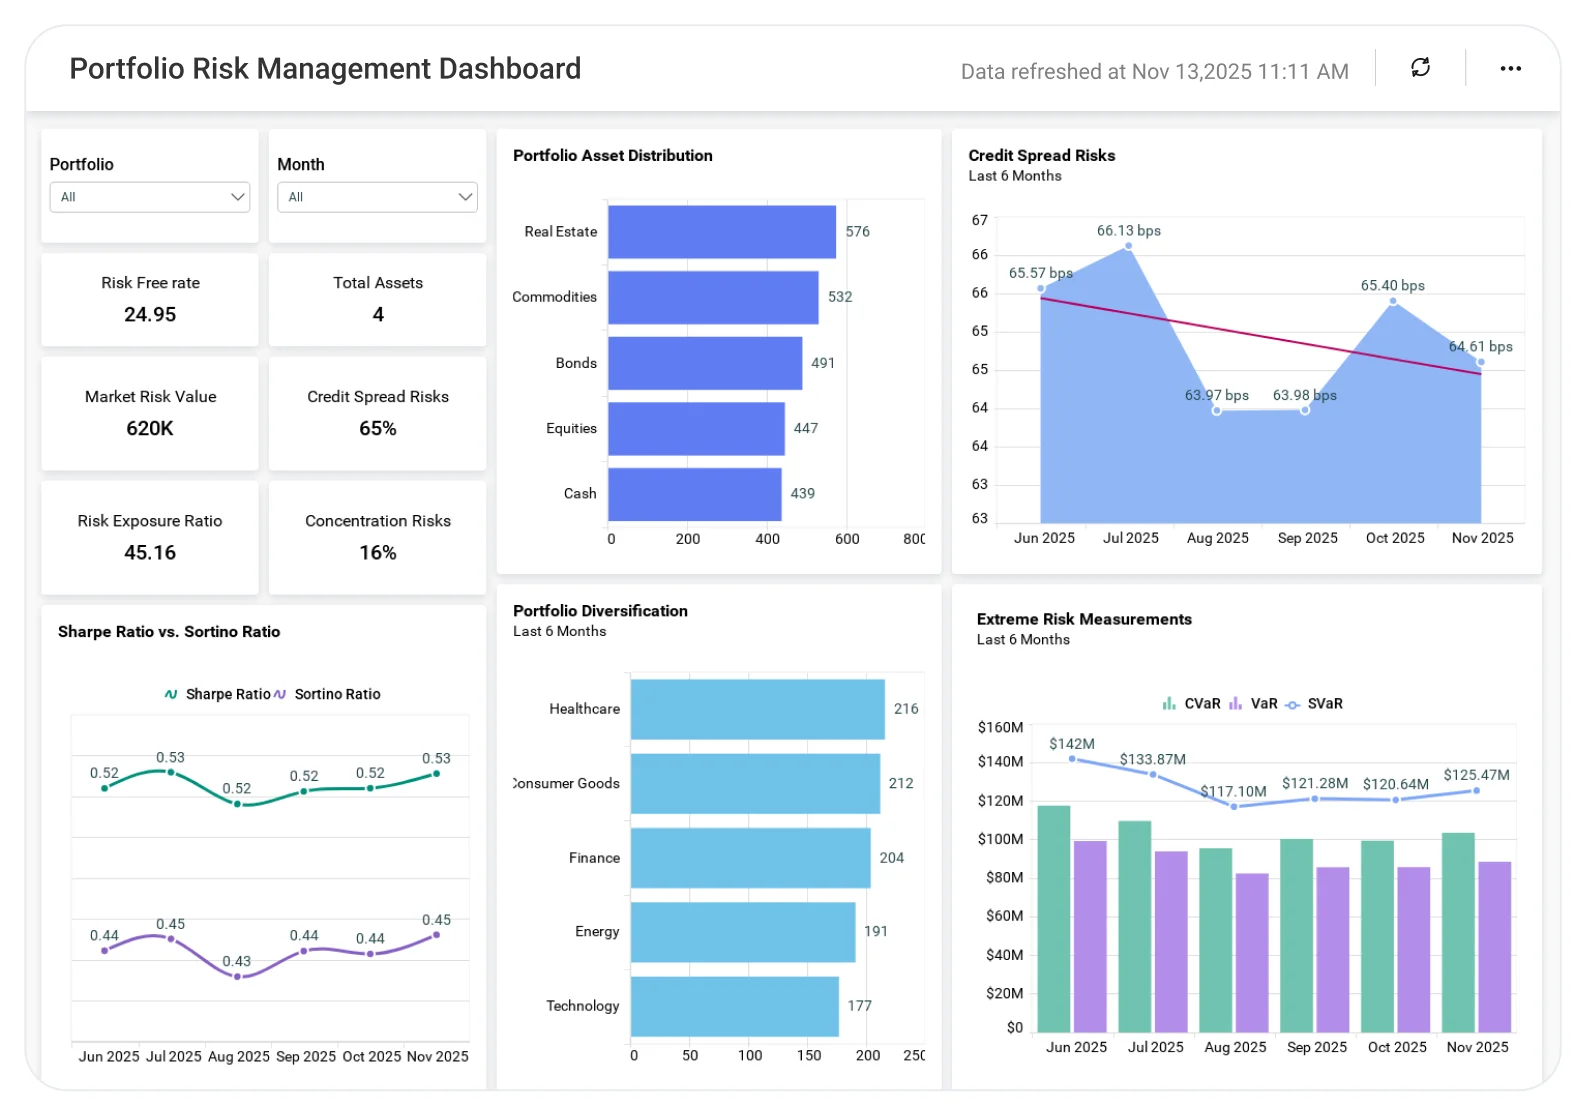
The Portfolio Risk Management Dashboard helps banks, financial institutions, and risk teams analyze exposure, volatility, and risk concentration across portfolios, enabling proactive risk mitigation, more disciplined capital allocation, and more informed strategic decisions.
TL;DR
-
Track portfolio-wide risk exposure and concentration to understand overall risk posture.
-
Compare asset-level and segment-level risk contributions to identify imbalance and hotspots.
-
Monitor volatility and performance risk indicators to assess sensitivity to market changes.
-
Analyze risk trends over time and across market segments to anticipate emerging threats.
-
Support proactive risk mitigation and capital allocation decisions with data-driven portfolio risk insights.
What Is a Portfolio Risk Management Dashboard?
A Portfolio Risk Management Dashboard helps financial teams measure, understand, and manage risk across investment or loan portfolios.
In Bold BI, this dashboard consolidates portfolio data, market indicators, and risk metrics to highlight vulnerabilities, assess risk-return balance, and support informed portfolio management decisions.
Why Portfolio Risk Management Dashboard Matters
Effective portfolio risk management is critical to protecting capital and ensuring long-term financial stability.
When risk data is scattered across reports and spreadsheets:
-
Concentration risks remain hidden.
-
Volatility exposure is underestimated.
-
Portfolio imbalances go unnoticed.
-
Risk response becomes reactive.
A centralized analytics dashboard enables institutions to shift from periodic risk reviews to continuous, insight-driven portfolio risk management.
What You’ll Track
Using Bold BI dashboards, you will track important KPIs such as:
-
Risk exposure distribution: Exposure levels by asset class, sector, or portfolio to identify concentration risks.
-
Volatility & risk indicators: Measures of portfolio volatility and sensitivity to market movements.
-
Segment-level risk analysis: Risk contribution by asset, customer segment, or geography.
-
Risk trend patterns: Changes in risk exposure over time to anticipate emerging portfolio vulnerabilities.
All dashboards are fully customizable, allowing you to add KPIs or metrics as needed.
How It Works
-
Apply the Portfolio Risk Management Dashboard sample.
-
Combine portfolio, market, and risk data in one unified view.
-
Analyze insights by portfolio, asset class, segment, or time period.
-
Share role-based dashboards with risk, finance, and leadership teams.
Why Bold BI Is the Right Fit for Portfolio Risk Management Analytics
-
Unified risk visibility: Bring portfolio exposure, performance, and risk data into a single analytics dashboard.
-
Centralized risk analysis: Evaluate concentration, volatility, and trends together.
-
Comparative portfolio insights: Compare portfolios, asset classes, or segments to identify imbalances.
-
Actionable drilldowns: Investigate high-risk assets, segments, or time periods in detail.
-
Flexible deployment: Deploy dashboards in cloud or self-hosted environments to align with enterprise IT needs.
Compare Options (at a glance)
| Feature | Bold BI | Risk System Reports | Spreadsheets |
| Portfolio risk analytics | Yes | Limited | Manual |
| Concentration & volatility insights | Yes | Partial | Manual |
| Cross-portfolio comparison | Yes | Limited | Manual |
| Risk trend analysis | Yes | Limited | No |
| Custom KPIs & drilldowns | Fully customizable | Fixed | Manual |


