ChartMogul Subscription Report Dashboard
Understand subscription revenue performance to drive growth and reduce churn.
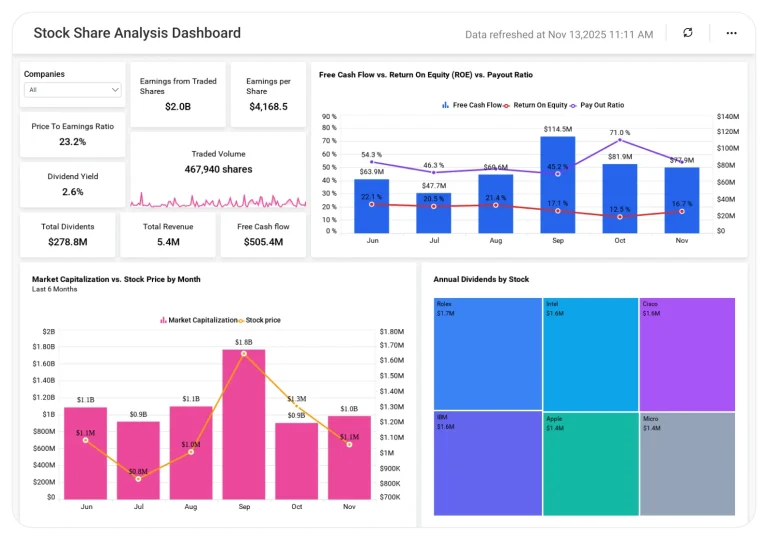
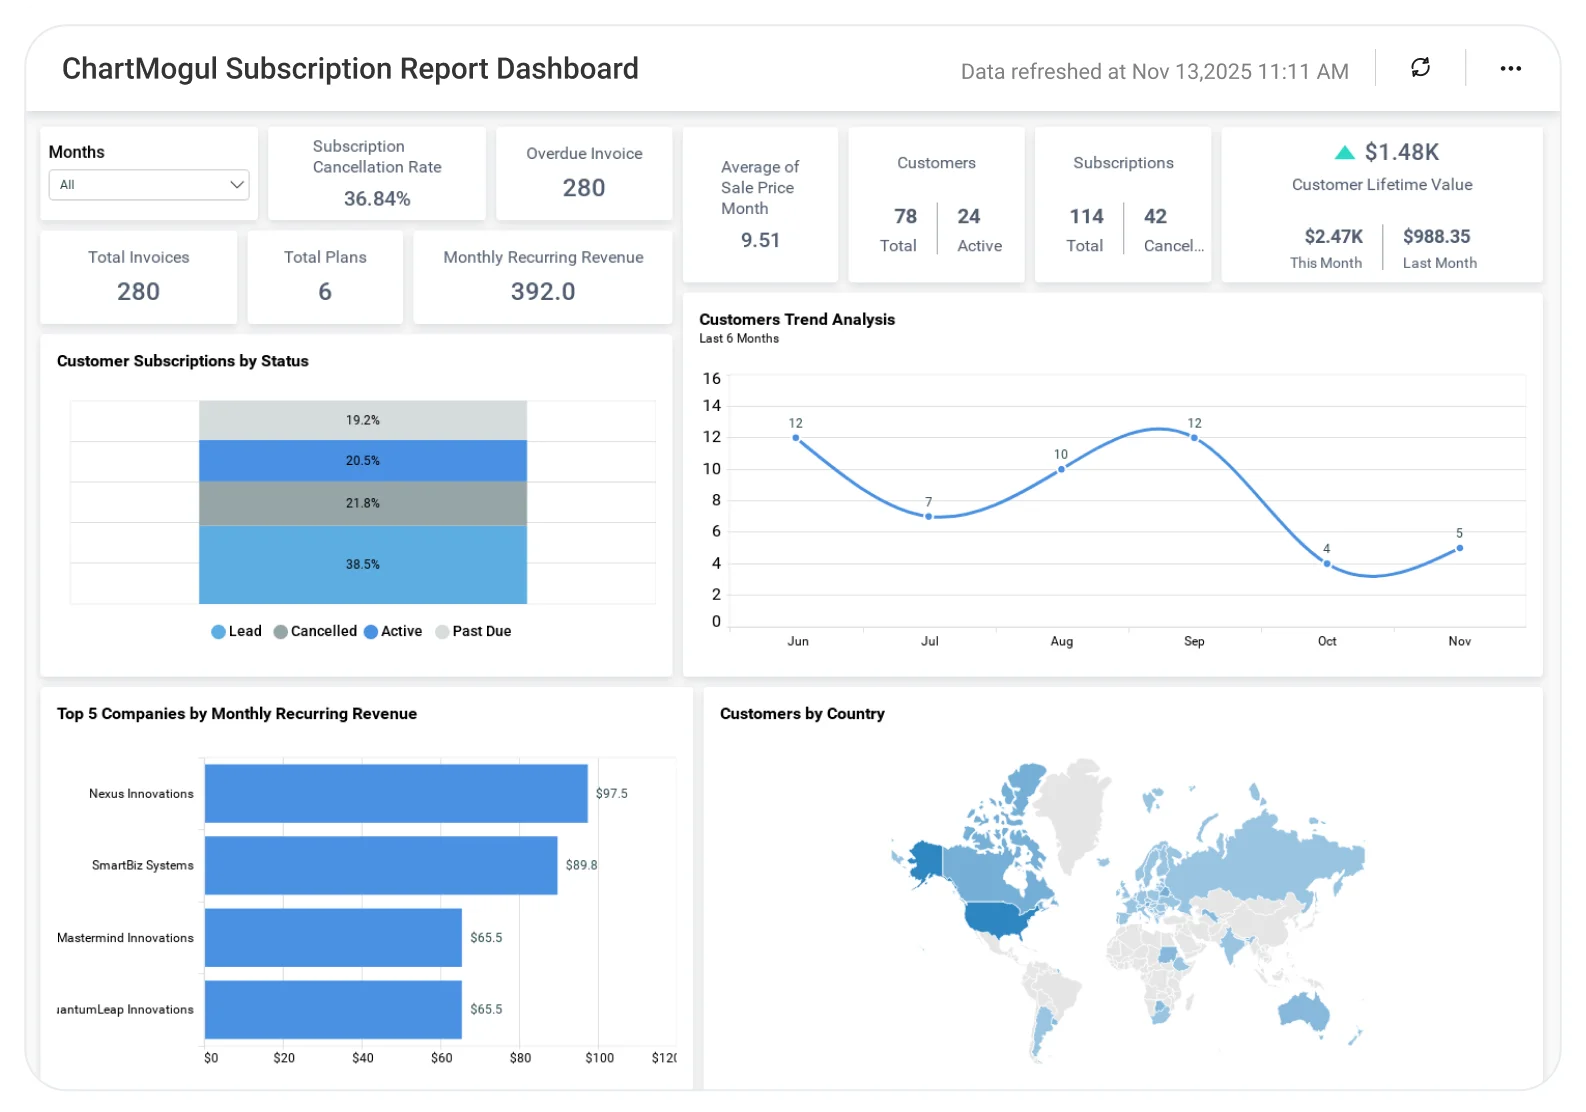
The ChartMogul Subscription Dashboard helps teams analyze MRR, churn, customer growth, and subscription trends, enabling better revenue forecasting, retention strategies, and sustainable subscription-based growth.
TL;DR
-
Real-time subscription analytics: Track customer growth, MRR, and churn as they change.
-
Revenue analysis: Monitor ARPA, invoices, and run-rate trends.
-
Cancellations & churn: Detect retention issues early before they worsen.
-
Location analysis: Discover the origins of your customers by country or area.
-
Dynamic filtering: Analyze patterns, over any time span you select.
What is a ChartMogul Subscription Dashboard?
A ChartMogul Subscription Dashboard visualizes recurring revenue, churn, and subscription growth in one place.
With Bold BI, ChartMogul subscription data is enhanced with analytics to track revenue stability, identify churn risks, and forecast future results.
Why ChartMogul Subscription Dashboard Matters
Subscription businesses depend on clear visibility into recurring revenue, churn, and customer growth. When key metrics are spread across multiple tools, it becomes difficult to spot risks early or make confident decisions.
Effective subscription analytics helps teams understand revenue trends, reduce churn, manage accounts receivable, and align finance and growth teams around one reliable view of performance.
What You’ll Track
Using Bold BI dashboards, you will track important KPIs such as:
-
Recurring revenue performance: Track monthly recurring revenue (MRR), company run rate, and revenue growth trends over time.
-
Customer value metrics: Monitor average revenue per account (ARPA) and how customer value evolves across periods.
-
Churn & cancellations: Measure subscription cancellation rates, churn trends, and identify early retention risks.
-
Billing & invoice activity: Analyze invoices, payments, refunds, overdue accounts, and subscription vs. one-time transactions.
How It Works
-
Connect sources of data from Excel, ChartMogul, and SQL databases.
-
Apply Sample: Choose the ChartMogul Subscription Dashboard.
-
Blend: Combine with CRM, billing, or ERP data for full context.
-
Share: Give role-based access to executives and analysts.
-
Act: Adjust pricing, retention, or sales strategies based on insights.
Why Bold BI Is the Right Fit for ChartMogul Subscription Report Analytics
Bold BI turns ChartMogul data into interactive dashboards that help teams understand trends, spot risks, and act with confidence.
Compare Options (at a glance)
| Feature | Bold BI | ChartMogul Reports | Spreadsheets |
|---|---|---|---|
| Subscription KPI analytics (MRR, ARR, ARPA) | Yes | Limited | Manual |
| Churn, retention & cohort tracking | Yes | Partial | Manual |
| Plan, customer segment & geography drilldowns | Yes | Limited | Manual |
| Expansion/contraction MRR & revenue movement visibility | Yes | Limited | Manual |
| Custom KPIs & dashboards | Fully customizable | Fixed | Manual |
Frequently Asked Questions
More Articles About ChartMogul Subscription Dashboard
-
Top 10 Finance Dashboards for Global Businesses
 This blog highlights essential finance dashboards that help subscription businesses track revenue, churn, and growth metrics effectively.
-
2023 in Review: How Bold BI Empowered Businesses
This blog explores key BI innovations and success stories from 2023, showing how dashboards improved subscription analytics and decision-making.