HR Payroll Dashboard for HR & Finance Teams
Understand payroll costs and compensation details to support accurate and compliant payroll processing.
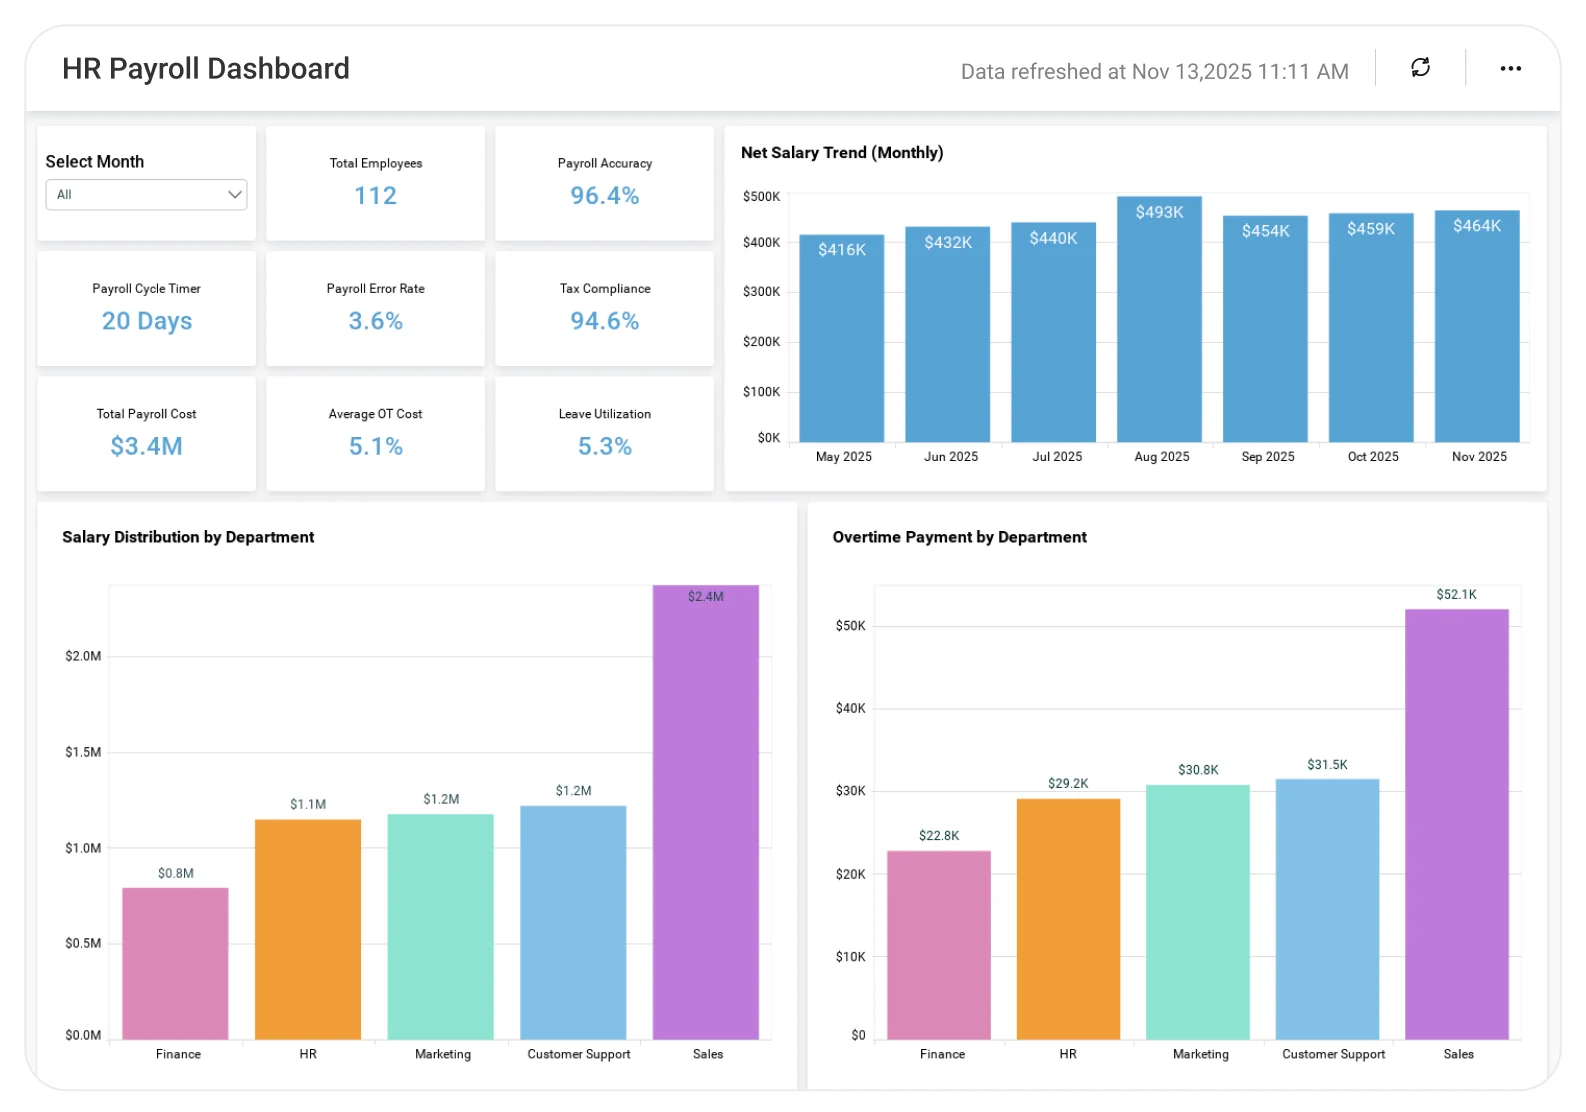
The Payroll Dashboard helps HR and finance teams analyze salaries, payroll expenses, deductions, and employee compensation trends, enabling better cost control, compliance, and informed payroll decisions.
TL;DR
-
Gross vs. net pay insights for each cycle.
-
Salary distribution breakdowns by department, job title, or location.
-
Performance-pay correlation with average performance score tracking.
-
Yearly payroll trend analysis with monthly cost movement.
-
Executive summary of payroll efficiency, workforce cost, and variance.
What Is an HR Payroll Dashboard?
It shows you the patterns behind your payroll and compensation data to support better planning.
In Bold BI, that means:
-
Interactive charts.
-
Department-level insights.
-
Employee-level drilldowns.
-
Secure role-based dashboard.
All connected to your payroll and HR systems.
Why HR Payroll Dashboard Matters
Employee dissatisfaction, budget misalignment, and compliance problems can result from payroll errors and dispersed data.
Bold BI gives you one reliable source for all payroll insights so you can answer:
-
What are our gross and net payroll totals?
-
Which departments or roles drive the most payroll cost?
-
How is employee performance influencing compensation?
-
Are payroll expenses increasing or stabilizing over time?
What You’ll Track
-
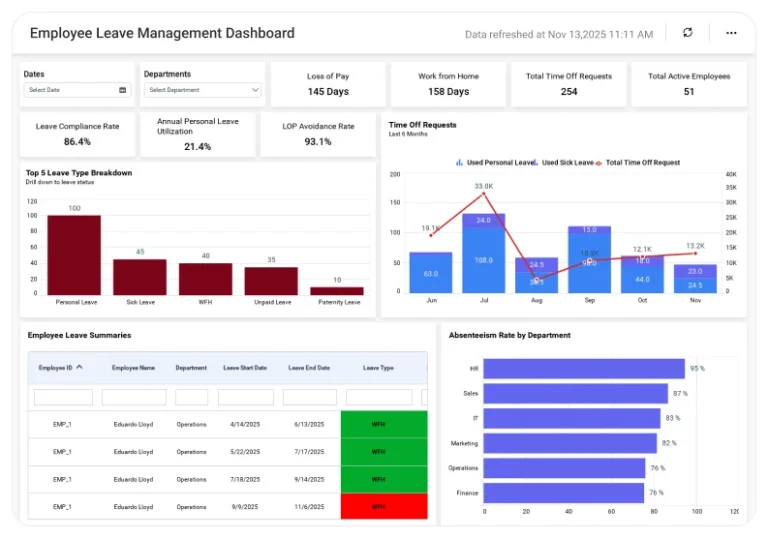
Gross & Net Pay Overview: See total gross pay, deductions, net pay, and overtime trends to quickly spot anomalies.
-
Salary Breakdown: Compare salary distribution by role, department, and region to identify high-cost areas.
-
Average Performance Score: Understand how performance links to compensation and where pay-for-performance needs tuning.
-
Payroll Trend Analysis: Track monthly and yearly payroll shifts, overtime spikes, and cost patterns to plan ahead.
All dashboards are fully customizable, so you can add KPIs or metrics as needed.
How It Works
Why Bold BI is the Right Fit for HR Payroll Analytics
-
Combine HRIS, payroll, and performance data in one dashboard.
-
Drill from organization-level payroll summaries to individual employees.
-
Enable self-service analytics for HR teams without IT dependency.
-
Embed dashboards in HR portals and deployment in cloud or on-premises environments.
Compare Options (at a glance)
| Feature | Bold BI | Payroll System Reports | Spreadsheets |
|---|---|---|---|
| Payroll summary by pay period/entity | Yes | Limited | Manual |
| Gross-to-net breakdown (earnings, deductions, taxes) | Yes | Partial | Manual |
| Overtime, bonuses & variable pay tracking | Yes | Limited | Manual |
| Payroll cost trends by department/location | Yes | Limited | Manual |
| Custom KPIs & dashboards | Fully customizable | Fixed | Manual |
Frequently Asked Questions
Payroll systems show cycle-level data only. Bold BI blends payroll + performance + department-level insights for deeper analysis.
Absolutely—Bold BI supports secure, token-based embedding.
Most teams connect payroll and HRIS systems in a few hours; deeper analytics depend on data complexity.
Yes—every widget, filter, and layout is customizable. Add or rename KPIs, create new drilldowns, or build department-specific dashboards without writing code.
Yes—set alerts for cost spikes, unusual deductions, overtime anomalies, or missed payroll runs. HR and finance teams receive instant notifications via email or in-app alerts.
More Articles About HR Payroll Dashboard
-
Payroll and Compensation Using BI Insights
 Discusses how business intelligence helps manage fair pay and compensation, improve employee satisfaction, and optimize payroll structures.
-
Multi-Tabbed Dashboard Use Cases
Shows how multi-tabbed dashboards can organize HR data, including payroll, for better productivity and analysis.
-
How to Create an HR Payroll Dashboard in Bold BI®
Learn how to create a comprehensive HR payroll dashboard using Bold BI, seamlessly connected to a PostgreSQL data source.