
Warehouse Performance Dashboard
Improve warehouse efficiency, reduce operational bottlenecks, and support faster fulfillment through data‑driven insights.
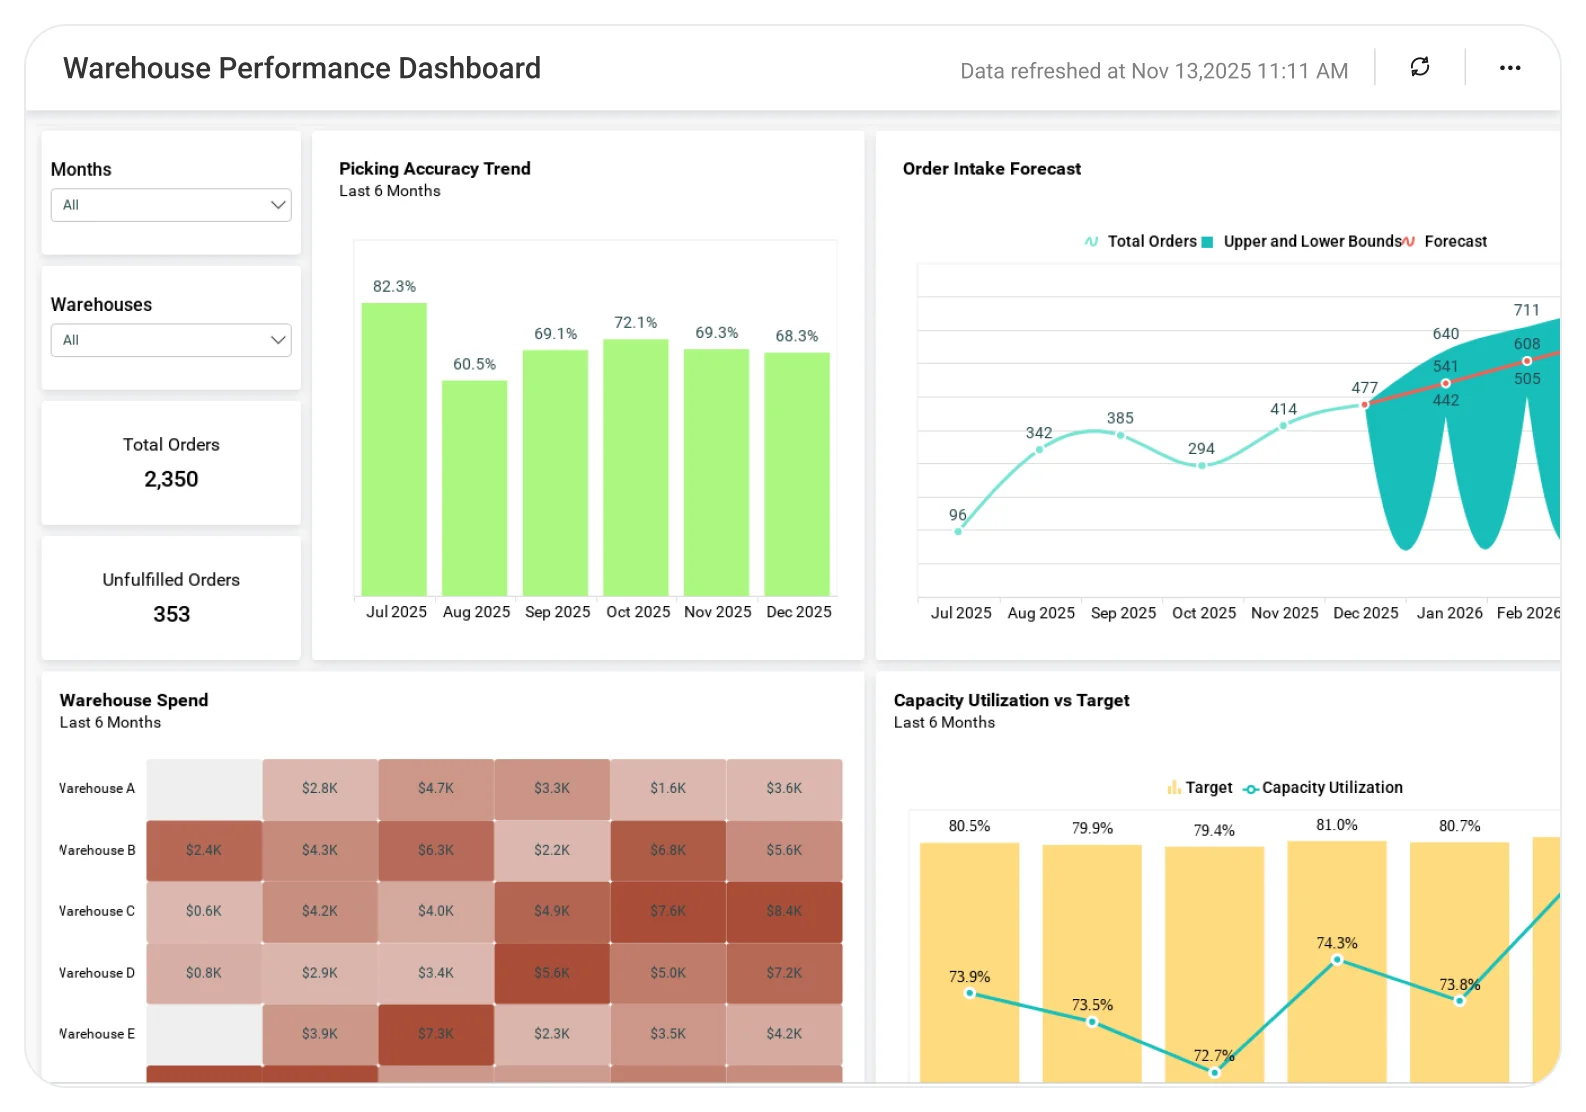
The Warehouse Performance Dashboard provides logistics leaders and warehouse teams with a single view of inventory movement, order processing, labor productivity, and fulfillment efficiency. This helps increase throughput and strengthen delivery reliability.
TL;DR
-
Track overall warehouse throughput and performance trends to understand operational efficiency.
-
Monitor inventory movement and stock handling patterns to identify congestion and handling issues.
-
Analyze order processing and fulfillment efficiency to reduce delays and improve delivery speed.
-
Evaluate labor productivity and workload distribution to balance staffing and shift performance.
-
Support faster, more reliable warehouse operations with data-driven performance insights.
What Is a Warehouse Performance Dashboard?
A Warehouse Performance Dashboard is an analytics solution that helps logistics and operations teams understand how effectively warehouse activities are executed, from inventory handling to order fulfillment.
In Bold BI, this dashboard brings together data from warehouse management systems, inventory records, and operational logs to reveal inefficiencies, monitor key performance drivers, and support informed decisions for warehouse optimization.
Why Warehouse Performance Dashboard Matters
Warehouse operations play a critical role in supply chain speed, cost control, and customer satisfaction.
When warehouse data is fragmented across reports and systems:
-
Processing delays go unnoticed.
-
Inventory handling inefficiencies increases costs.
-
Labor utilization is hard to balance.
-
Fulfillment performance lacks transparency.
A centralized warehouse dashboard helps teams move from reactive issue resolution to proactive performance management.
What You’ll Track
Using Bold BI dashboards, you will track important KPIs such as:
-
Order fulfillment performance: Order processing time, pick-pack-ship efficiency, and fulfillment rates to assess operational speed.
-
Inventory movement metrics: Inbound, outbound, and internal stock movement patterns to identify handling delays and bottlenecks.
-
Labor productivity indicators: Output per worker, workload distribution, and productivity trends across shifts or teams.
-
Warehouse throughput analysis: Volume of goods processed over time to understand capacity utilization and peak load periods.
All dashboards are fully customizable, allowing you to add KPIs or metrics as needed.
How It Works
-
Apply the Warehouse Performance Dashboard sample.
-
Combine inventory, order, and labor data in one unified view.
-
Analyze insights by warehouse, zone, process type, or time period.
-
Share role-based dashboards with warehouse managers and operations teams.
Why Bold BI Is the Right Fit for Warehouse Performance Analytics
-
Unified warehouse visibility: Bring inventory, order, and labor data into a single analytics dashboard.
-
Centralized performance analysis: Evaluate throughput, productivity, and fulfillment efficiency together.
-
Comparative insights: Compare warehouses, zones, or shifts to identify performance gaps.
-
Actionable drilldowns: Investigate delays, productivity dips, or inventory congestion in detail.
-
Flexible deployment: Deploy dashboards in cloud or self-hosted environments to match logistics IT needs.
Compare Options (at a glance)
| Feature | Bold BI | WMS Reports | Spreadsheets |
| Warehouse performance analytics | Yes | Limited | Manual |
| Order fulfillment insights | Yes | Partial | Manual |
| Labor productivity analysis | Yes | Limited | Manual |
| Cross-warehouse comparison | Yes | Limited | Manual |
| Custom KPIs & drilldowns | Fully customizable | Fixed | Manual |


