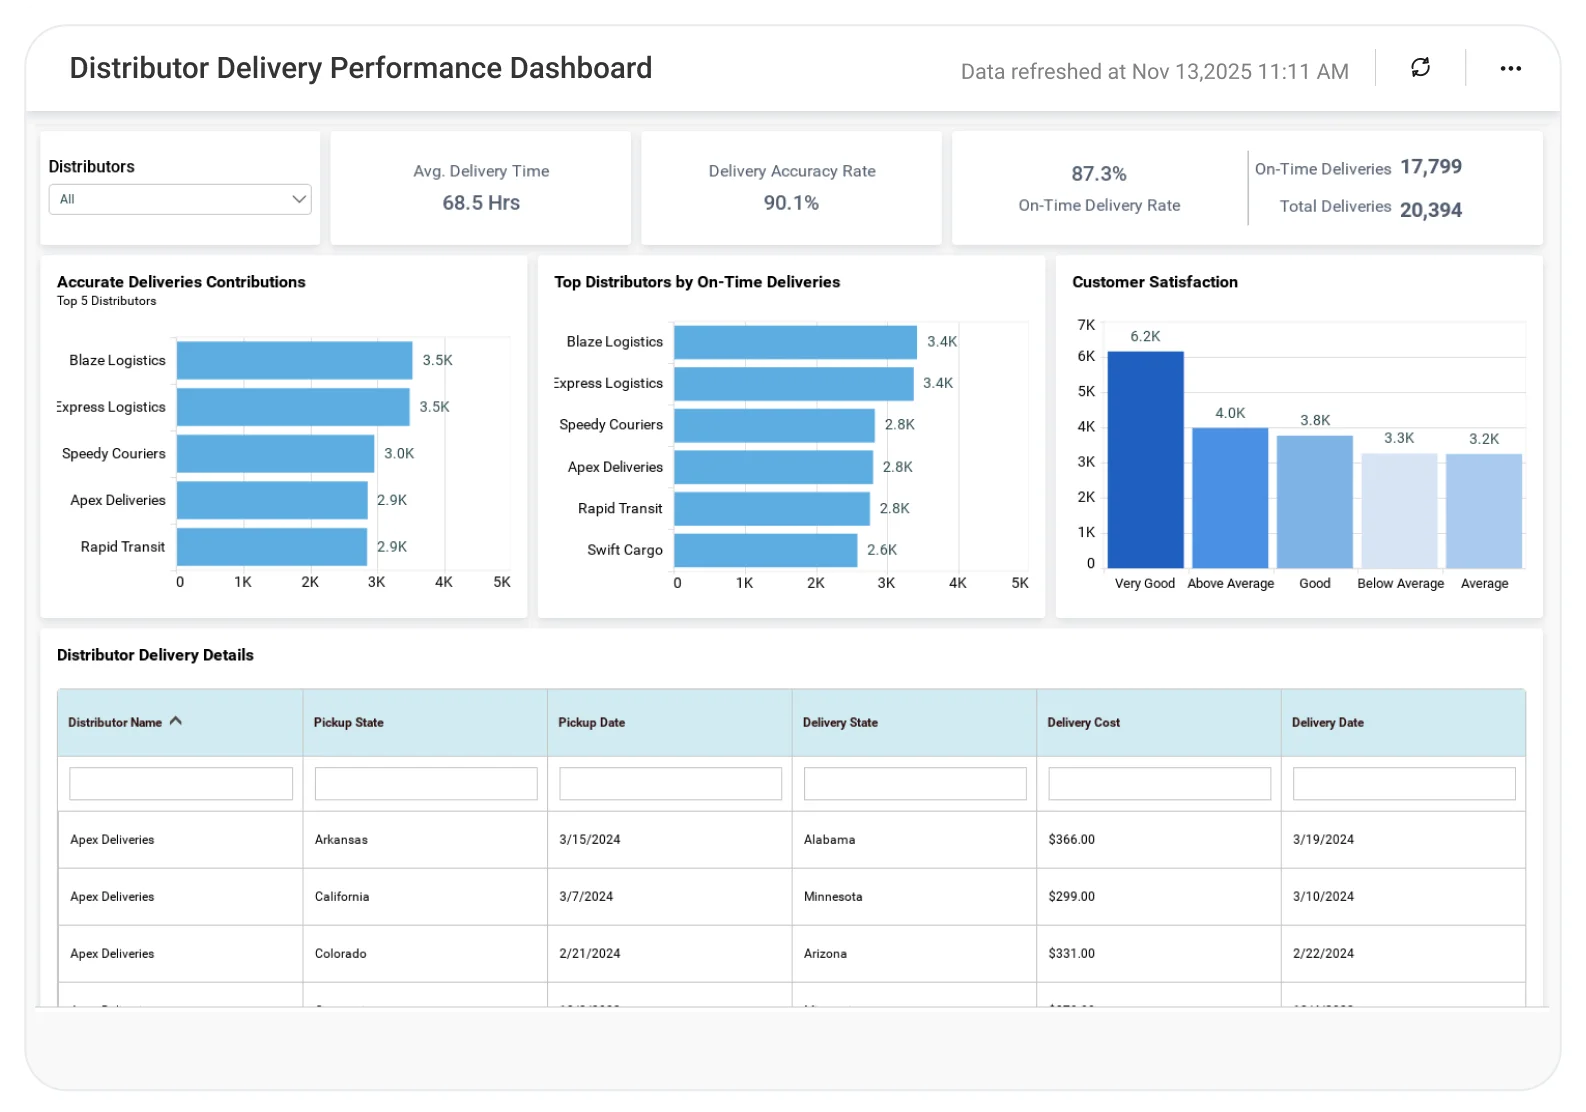
Distributor Delivery Performance Dashboard
Gain clear visibility into delivery performance, assess distributor effectiveness, and monitor fulfillment outcomes through a centralized, interactive dashboard.
The Distributor Delivery Performance Dashboard enables logistics and operations teams to track delivery timelines, distributor efficiency, and fulfillment outcomes in one unified view. This supports stronger accountability and faster issue resolution.
TL;DR
-
Monitor distributor delivery performance in one unified dashboard, from volumes to timelines.
-
Track on-time vs delayed deliveries to quickly assess reliability and SLA adherence.
-
Compare distributor efficiency across regions and routes to identify top and underperformers.
-
Analyze delay reasons and bottlenecks to drive targeted performance improvements.
-
Improve delivery reliability and distributor accountability with data-driven logistics insights.
What Is a Distributor Delivery Performance Dashboard?
A Distributor Delivery Performance Dashboard is an analytics solution that helps logistics and supply chain teams evaluate how effectively distributors meet delivery commitments.
In Bold BI, this dashboard consolidates shipment data, delivery timelines, and distributor performance metrics to identify gaps, compare partners, and support data-driven logistics decisions.
Why Distributor Delivery Performance Dashboard Matters
Delivery performance plays a critical role in organizational efficiency and service reliability. Without a consolidated view:
-
Delays are noticed late.
-
Underperforming distributors remain unidentified.
-
Root causes behind delivery issues stay unclear.
-
Improvement efforts lack measurable metrics.
A unified dashboard shifts teams from reactive issues handling to proactive monitoring and performance management by visualizing accuracy, timeliness, and fulfillment data in one place.
What You’ll Track
Using Bold BI dashboards, you will track important KPIs such as:
-
On-time delivery rate: Measures how consistent deliveries meet expected timeframes.
-
Distributor performance comparison: Identifies top and low-performing distributors based on timeliness, accuracy, and delivery volume.
-
Delivery volume trends: Shows how delivery frequency changes over time to reveal patterns and workload variations.
-
Accuracy and delay analysis: Breaks down the reasons for delivery delays and highlights areas requiring attention.
All dashboards are fully customizable, allowing you to add KPIs or metrics as needed.
How It Works
-
Apply the Distributor Delivery Performance Dashboard sample.
-
Combine shipment, distributor, and delivery data in one unified view.
-
Analyze insights by distributor, region, route, or time period.
-
Share dashboards with stakeholders for performance tracking and review.
Why Bold BI Is the Right Fit for Distributor Delivery Performance Analytics
-
Unified delivery visibility: Bring distributor performance and delivery data into a single analytics dashboard.
-
Centralized performance analysis: Evaluate timelines, volumes, and delay drivers together.
-
Comparative distributor insights: Compare distributors to support performance reviews and improvement plans.
-
Actionable drilldowns: Explore specific deliveries, timelines, or distributor records for deeper insight.
-
Flexible deployment: Deploy dashboards in cloud or self-hosted environments to meet banking IT requirements.
Compare Options (at a glance)
| Feature | Bold BI | Distribution Reports | Spreadsheets |
| Distributor performance analytics | Yes | Limited | Manual |
| On-time delivery tracking | Yes | Partial | Manual |
| Delay reason analysis | Yes | Limited | Manual |
| Cross-distributor comparison | Yes | Limited | Manual |
| Custom KPIs & drilldowns | Fully customizable | Fixed | Manual |