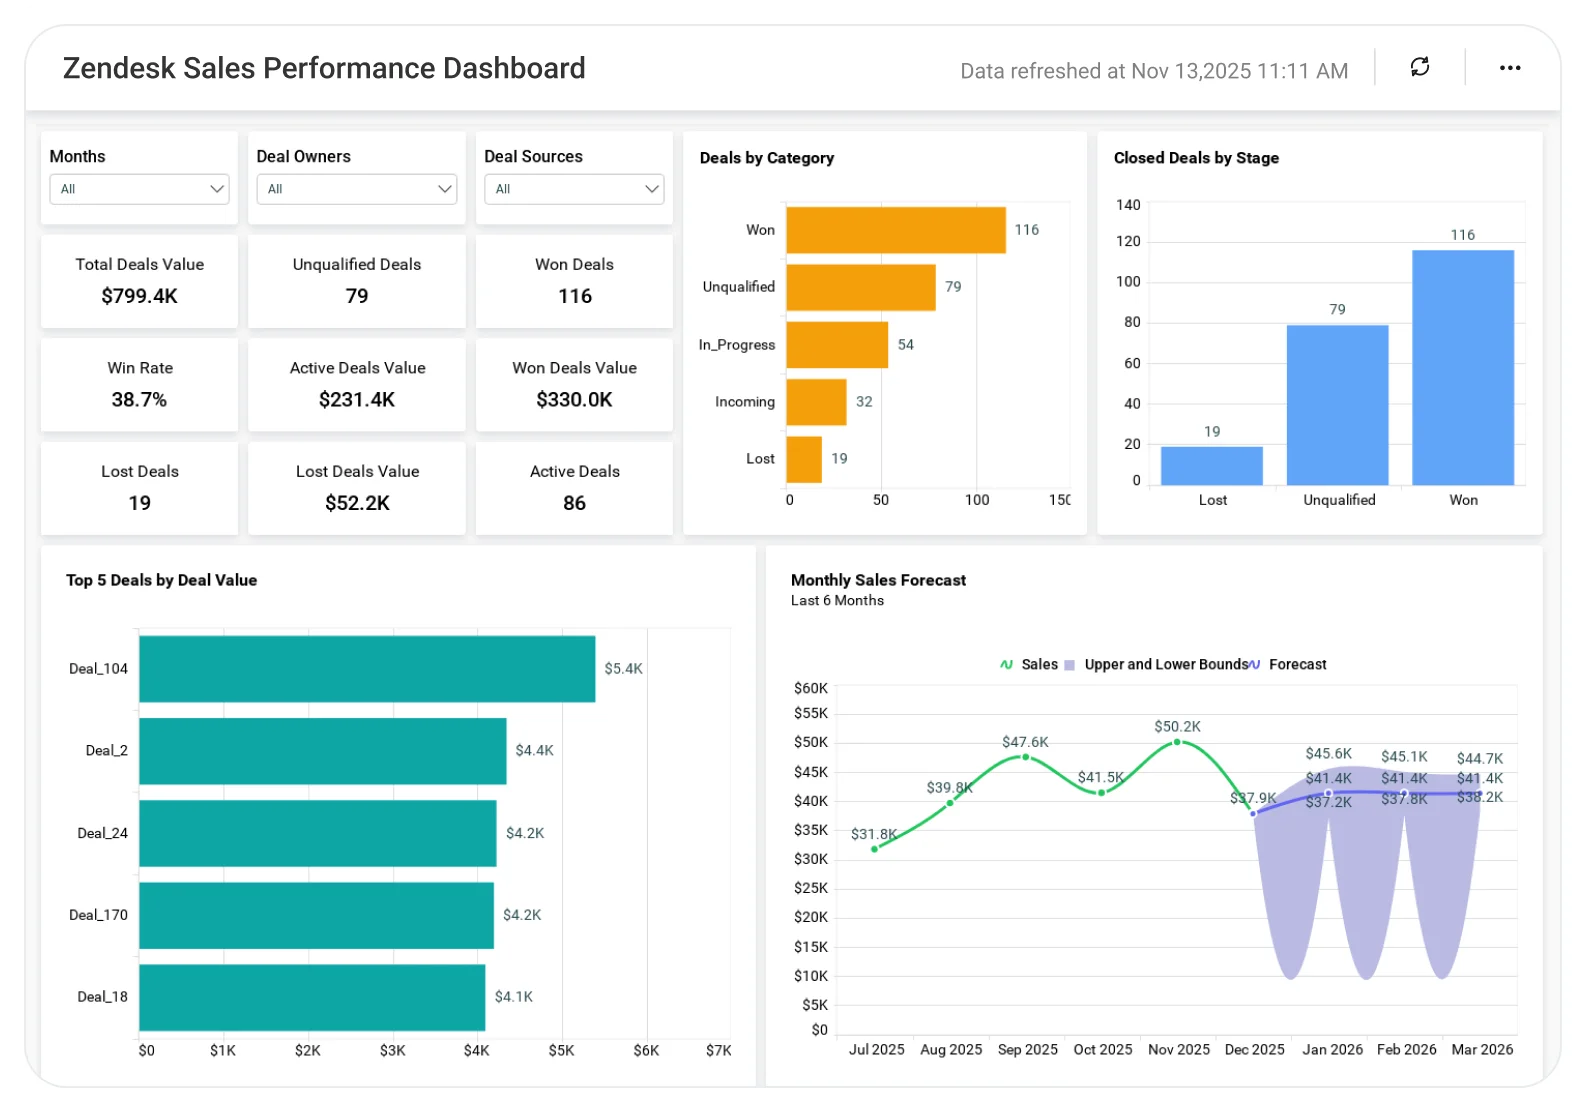
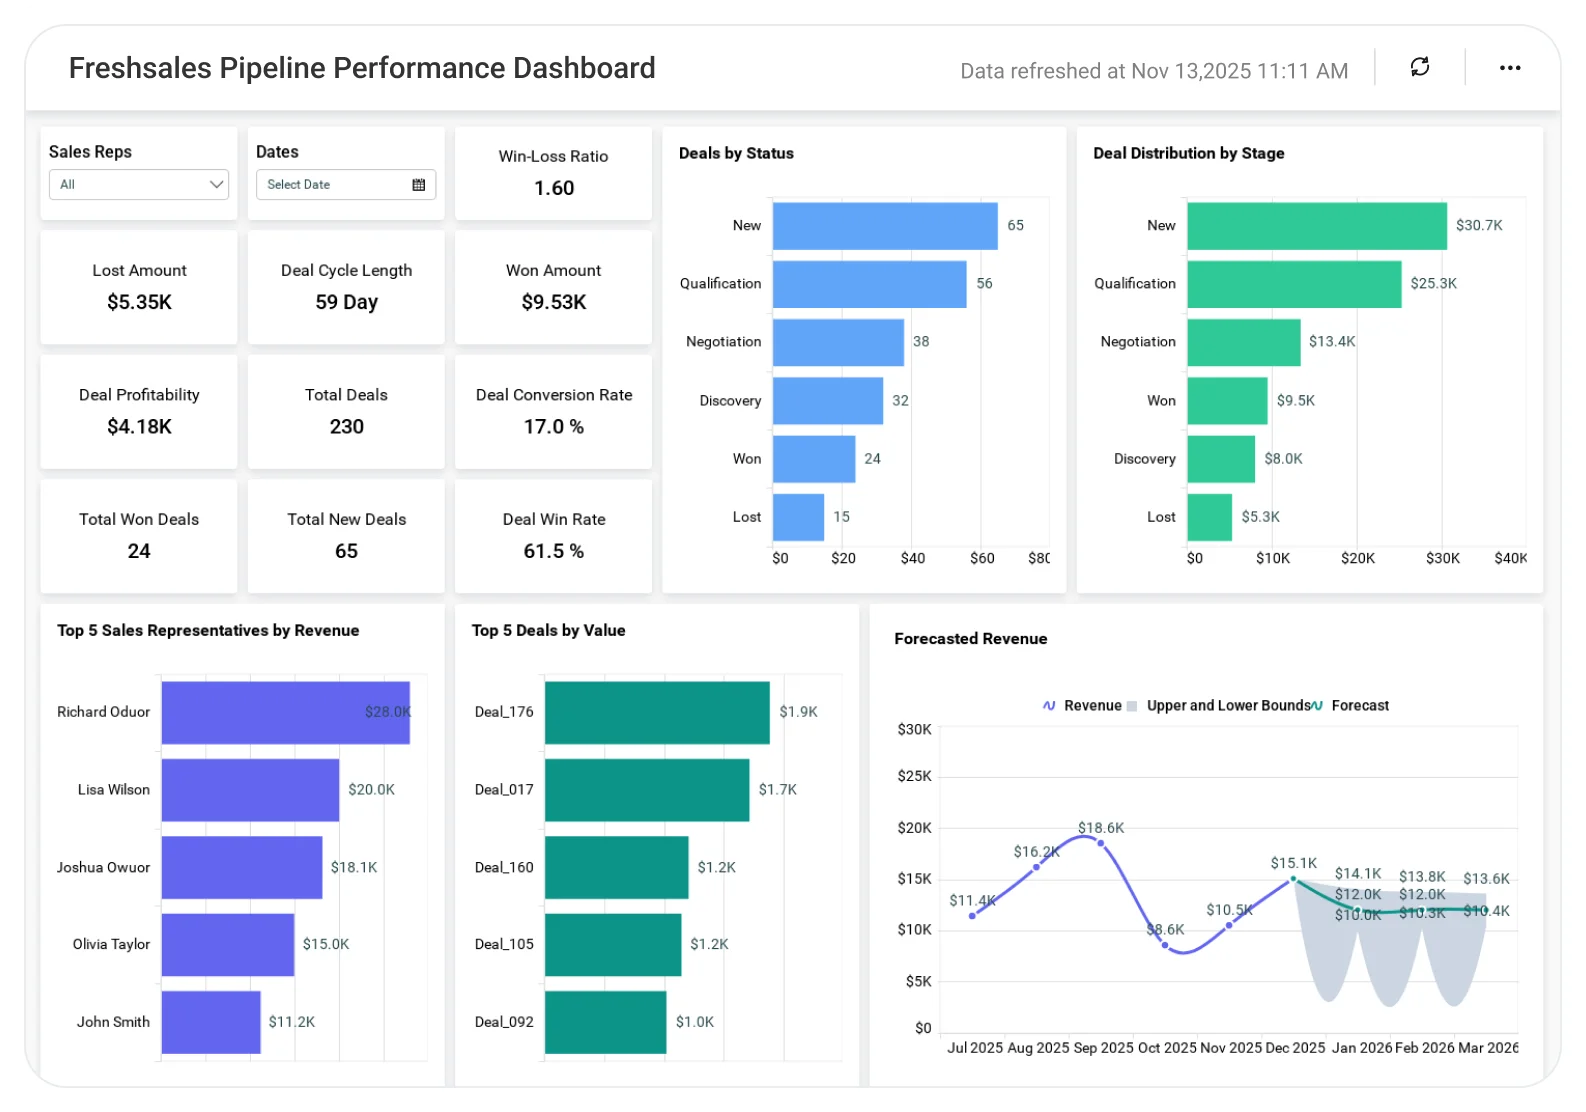
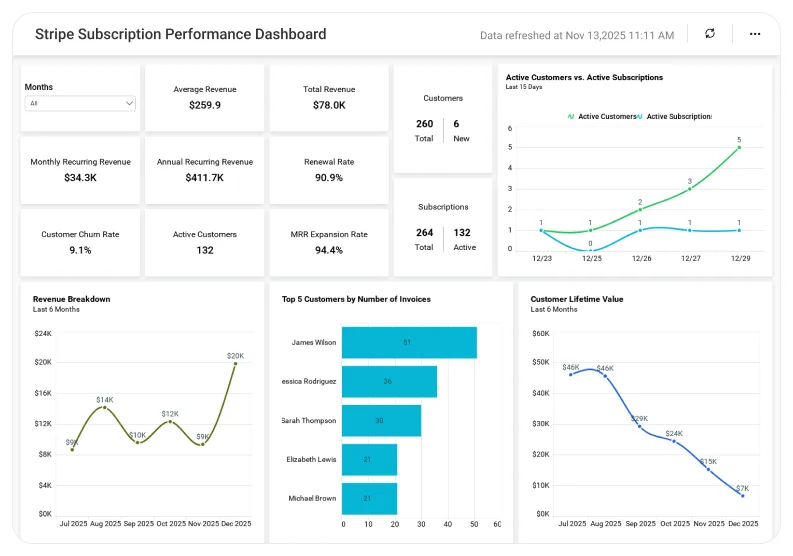
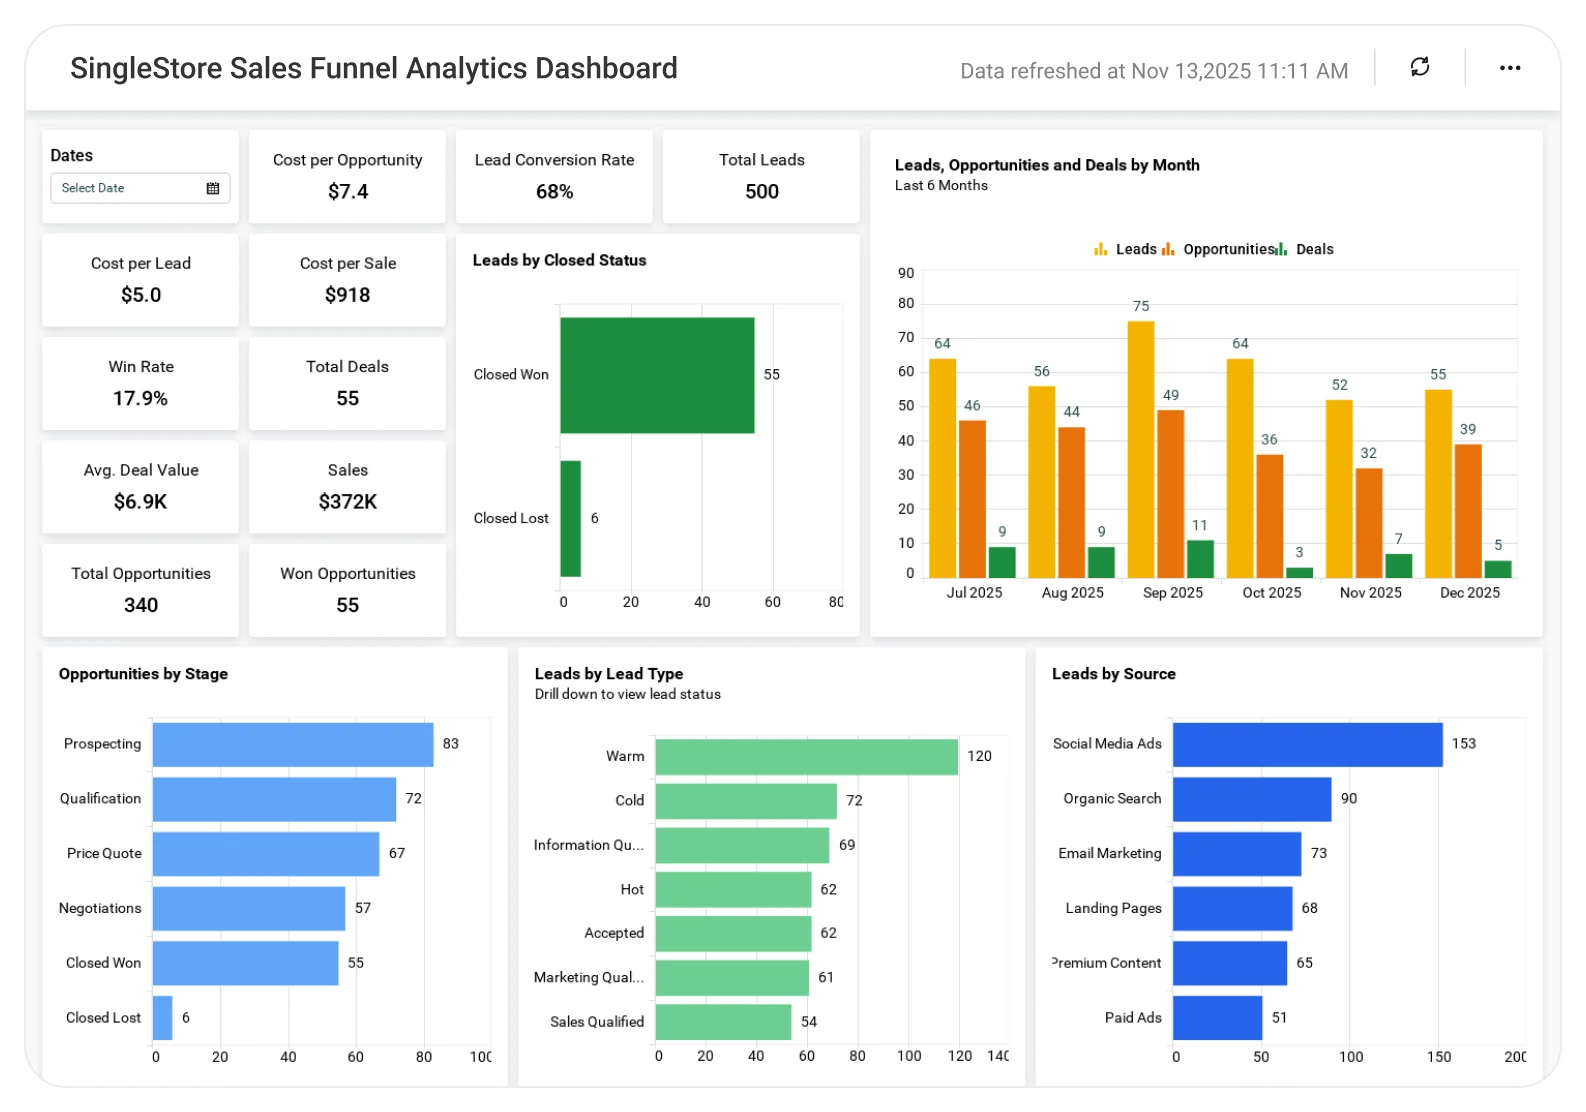
ActiveCampaign Deals Performance Dashboard for Sales Leaders
Improve deal conversion rates by gaining clear visibility into your sales pipeline.
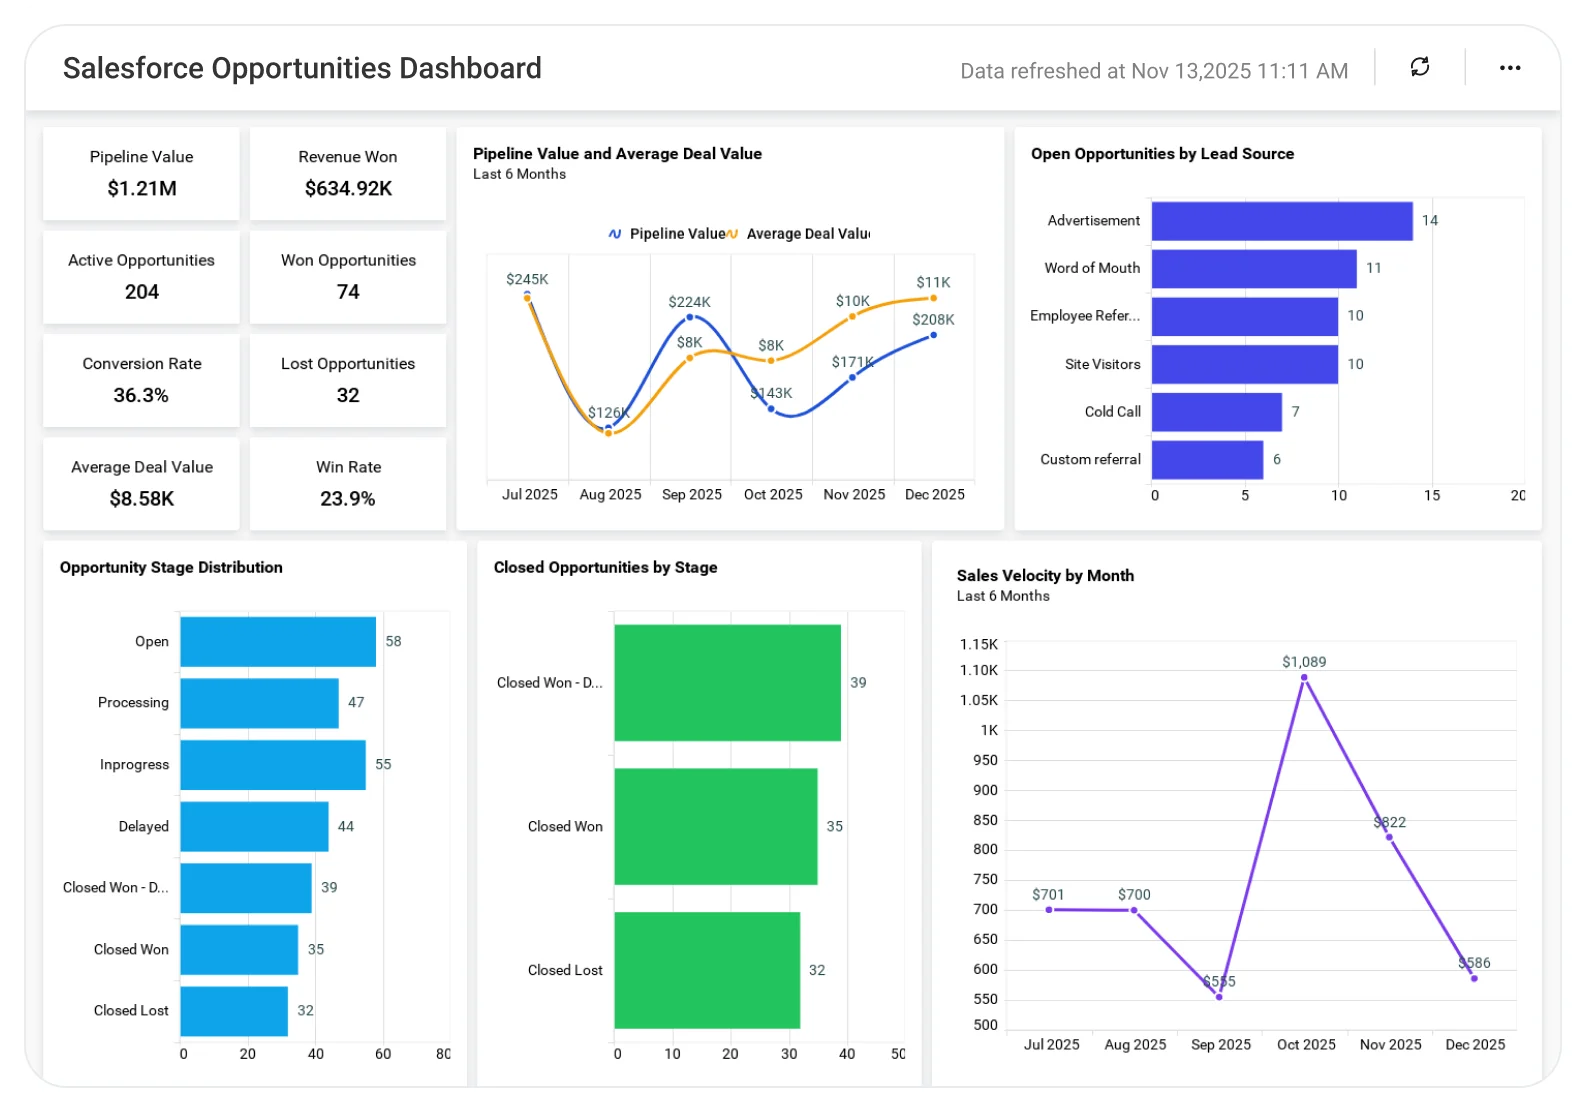
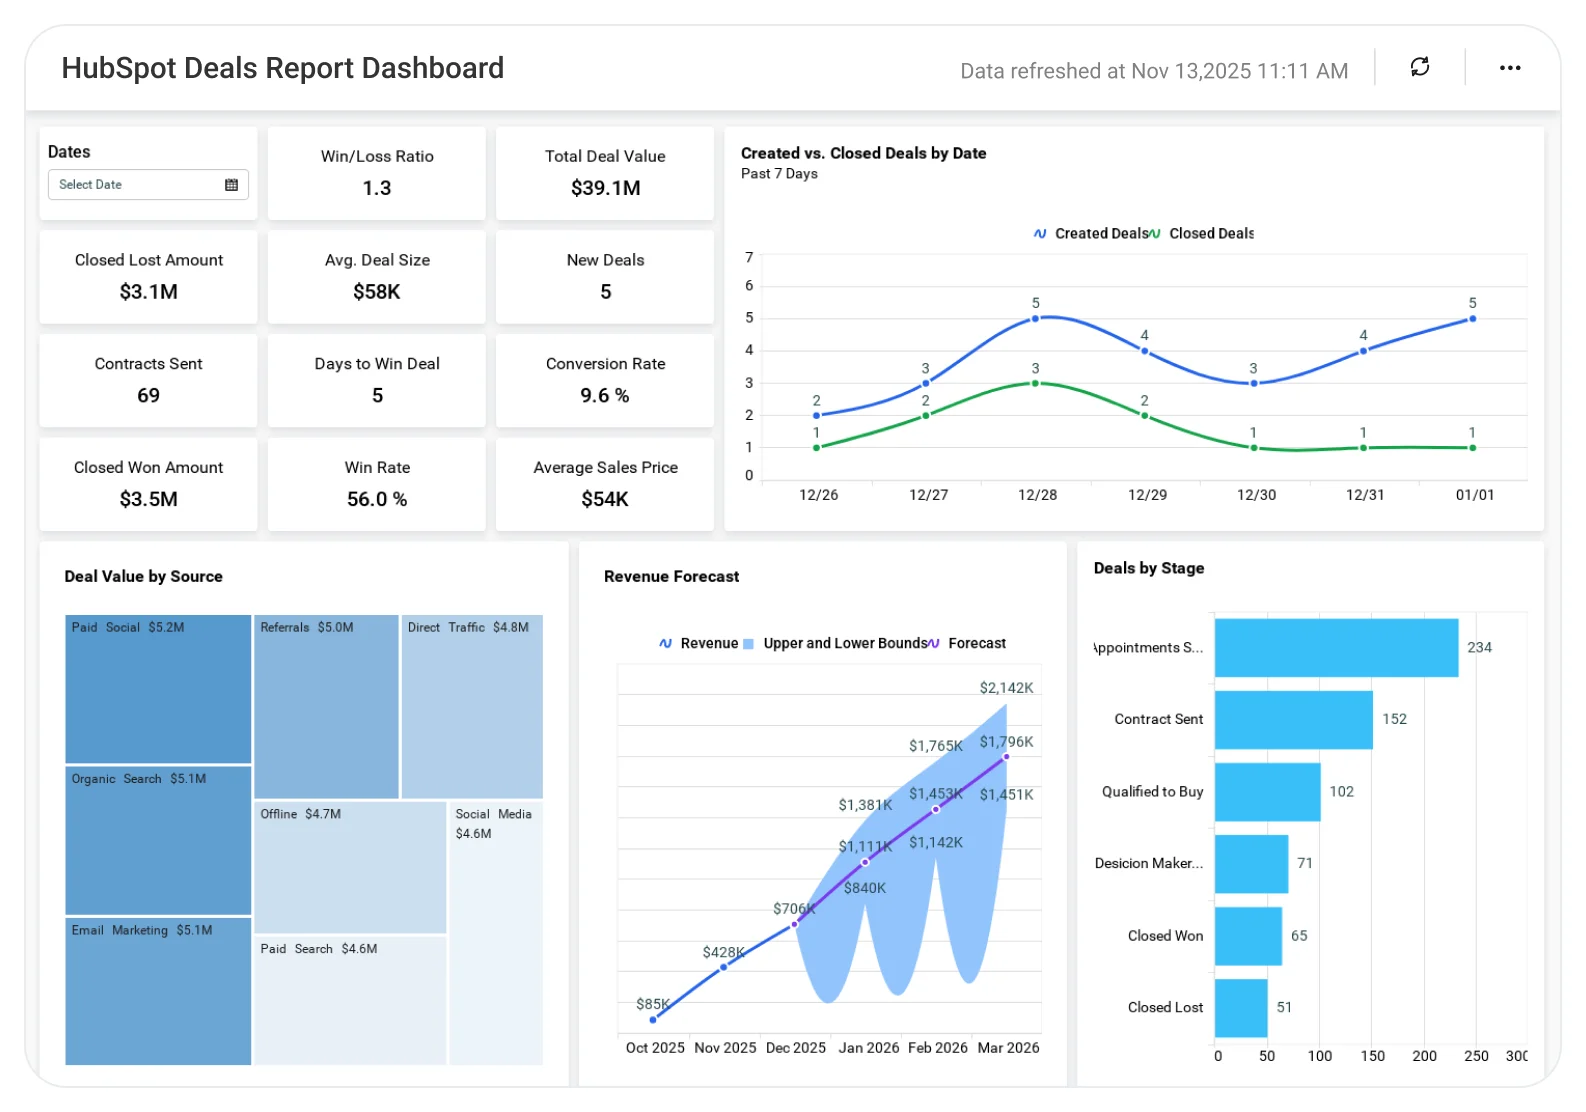
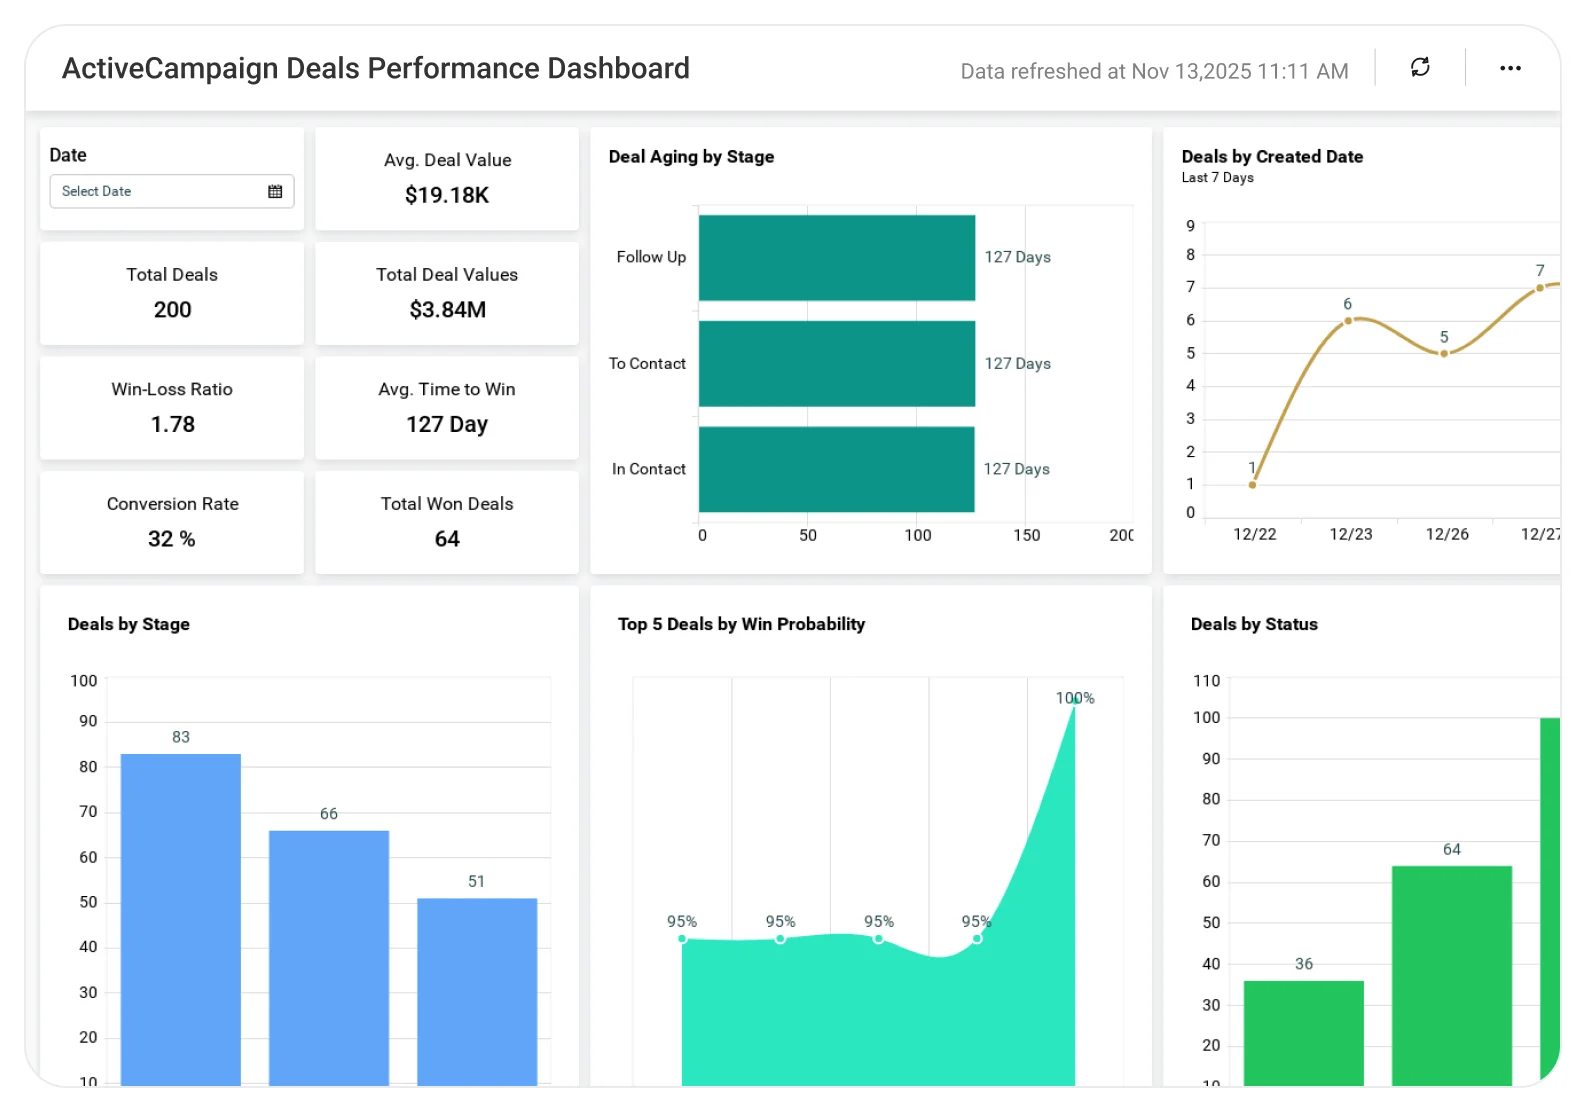
The ActiveCampaign Deals Dashboard helps sales teams analyze deal stages, pipeline value, win–loss trends, and sales velocity, enabling better forecasting, focused follow-ups, and faster deal closures.
TL;DR
-
Deal performance: Win rates, conversion rates, average deal size.
-
Pipeline health: Stage distribution, weighted vs. unweighted pipeline.
-
Rep productivity: Activities completed, deal velocity, quota progress.
-
Risk & opportunity signals: Stalled deals, aging pipelines, missed follow-ups.
-
Forecast accuracy: Probability-adjusted revenue and stage-based insights.
What Is an ActiveCampaign Sales Deals Performance Dashboard?
ActiveCampaign Deals Dashboard is a visual way to understand how effectively your team converts deals into revenue.
In Bold BI, that includes real-time KPIs showing:
-
How fast deals move?
-
How often do they convert?
-
Where they stall?
-
Which actions drive win?
Why ActiveCampaign Sales Deals Performance Dashboard Matters
When performance data is scattered across tools or locked in manual exports, it’s hard to see what truly drives revenue.
Bold BI helps you answer:
-
Which reps are outperforming, and why?
-
Where do deals stall in the funnel?
-
Whether activity levels support upcoming targets.
-
Which deals need immediate attention?
What You’ll Track
-
Deal performance: Win rates, win/loss trends, average deal size, deal velocity, and probability-adjusted revenue.
-
Pipeline health: Stage distribution, bottlenecks, pipeline aging, stalled deals, and deal movement (new vs. progressing vs. lost).
-
Rep activity: Calls, emails, meetings, tasks, activity-to-deal conversion, time spent per stage, and quota progress.
-
Revenue & forecasting: Weighted vs. unweighted pipeline, best-case, commit, and most-likely forecasts, and quarter-over-quarter performance.
Each dashboard is fully customizable, allowing you to add lead source insights, marketing contribution, financial KPIs, and tailor views to your sales process.
How It Works
-
Connect ActiveCampaign API (plus HubSpot Connector, CRM, Excel, SQL, or warehouses if needed).
-
Apply the deals performance sample and let the prebuilt KPIs auto populate.
-
Blend data with activity logs, marketing engagement, or revenue numbers.
-
Set alerts for risk signals like stalled deals, low activity, or forecast slippage.
Why Bold BI Is the Right Fit for ActiveCampaign Deals Performance Analytics
-
End-to-end revenue visibility: Combine pipeline, deal activity, forecasting, and financial data in one platform.
-
Deep drilldowns: Navigate from company-level KPIs down to individual deals or sales rep performance.
-
Self-service analytics for all roles: Provide dashboards for reps, managers, finance leaders, and executives without relying on static CRM reports.
-
Secure & governed sharing: Protect sensitive revenue data with Row Level Security(RLS), Single Sign On(SSO), Role Based Access Control(RBAC), and auditing.
Compare Options (at a glance)
| Feature | Bold BI | ActiveCampaign Deal Reports | Spreadsheets |
|---|---|---|---|
| Pipeline & deal stage performance (by owner/team) | Yes | Limited | Manual |
| Win rate, average deal size, and sales cycle length | Yes | Partial | Manual |
| Deal velocity & stage conversion (drop-offs, bottlenecks) | Yes | Limited | Manual |
| Forecast vs. target tracking (expected vs. actual revenue) | Yes | Partial | Manual |
| Deal aging, stalled deals, and next-step visibility | Yes | Limited | Manual |
| Drilldowns by pipeline, owner, source, and timeframe | Yes | Limited | Manual |
| Custom KPIs, goals, and dashboards | Fully customizable | Fixed | Manual |
Frequently Asked Questions
More Articles About Activecampaign Deals Dashboard
-
Tracking ActiveCampaign Deal Performance Using BI Dashboard
 Covers benefits like improved visibility, accurate forecasting, and better decision-making. Offers tips for defining KPIs, segmenting leads, and integrating with other tools.