

Analytics Maturity Model: Stages and How to Advance
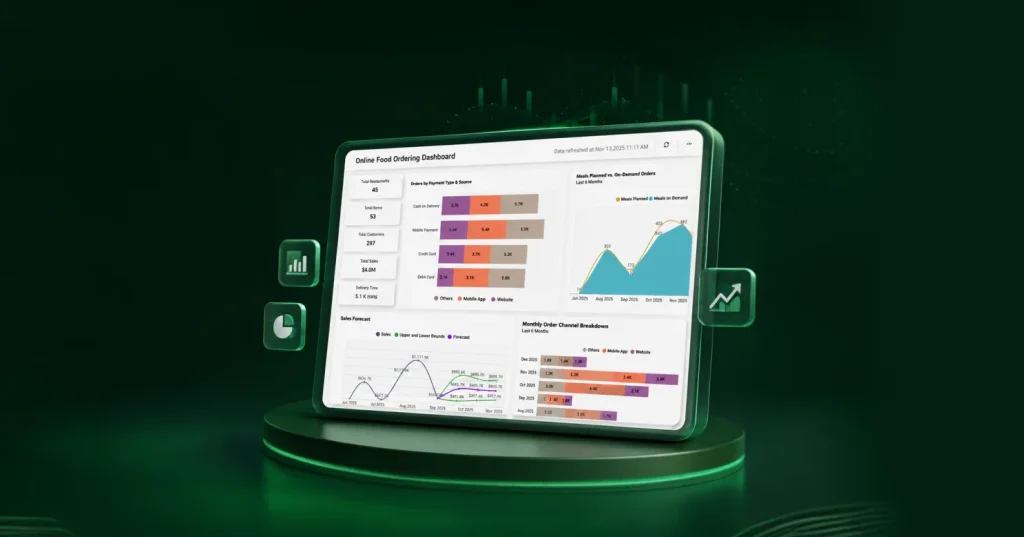
TL;DR: Organizations invest heavily in analytics, yet many struggle to turn data into consistent business value. An analytics maturity model helps organizations assess their analytics capabilities, identify gaps, and create a roadmap for improvement. This guide explores the five stages of analytics maturity, provides a practical assessment framework, and outlines the steps needed to advance toward data-driven and AI-enabled decision-making.
Introduction
Many organizations have invested heavily in analytics tools, data platforms, and business intelligence initiatives. Yet turning data into consistent business value remains a challenge.
As analytics, artificial intelligence (AI), and machine learning become more embedded in business operations, leaders are under growing pressure to make faster, more informed decisions. Common obstacles such as data silos, poor data quality, limited analytics adoption, governance gaps, and disconnected systems can slow progress.
An analytics maturity model provides a structured way to evaluate these capabilities. This guide explores the five stages of analytics maturity, provides a practical assessment framework, and outlines the steps needed to advance toward data-driven and AI-enabled decision-making, so organizations can better evaluate their current capabilities and understand how Bold BI® can support their analytics journey.
What is an analytics maturity model?
An analytics maturity model is a framework that shows how an organization’s use of data typically progresses, from basic historical analytics to real-time, predictive, and eventually automated decision-making. Instead of a rigid checklist, it works best as a diagnostic lens: something leaders use to understand where their current data practices stand, identify the gaps holding them back, and chart a realistic path toward becoming more data- driven.
Maturity doesn’t happen on its own. It’s the result of deliberate investment across three areas: the people who interpret data, the processes that govern how it’s used, and the technology that makes it accessible, all advancing together. Most models describe this progression in stages, such as moving from simple descriptive analytics to diagnostic analysis of why something happened, to predictive forecasting of what’s likely next, and finally to prescriptive systems that recommend or automate the best action.
Why analytics maturity matters for your business
Understanding where your organization sits on the analytics maturity model is not just a technical exercise. It has a direct impact on business outcomes.
Higher analytics maturity typically leads to:
- Faster decision-making: Teams can move from waiting days for dashboards to accessing insights in minutes, accelerating operational and strategic decisions.
- Improved forecasting: Predictive capabilities help teams anticipate demand, identify risks earlier, and adjust plans before issues affect business performance.
- Fewer analytics bottlenecks: Self-service tools can reduce routine dashboard turnaround times from days to hours, helping teams act on insights while they are still relevant and freeing analysts for higher-value work.
- Better resource allocation: Data-driven insights help leaders identify which projects, regions, or initiatives deliver the greatest return, improving investment decisions and reducing resource waste.
- Stronger competitive position: Organizations that turn insights into action faster can respond more quickly to market changes, customer needs, and emerging risks.
Gartner research shows a growing share of B2B organizations are shifting from intuition-based decisions toward data-driven ones, making analytics maturity a rising priority for leadership, not just data teams.
The five stages of analytics maturity
Organizations typically progress through several stages as their analytics capabilities evolve. While the pace of progression varies, each stage reflects a shift in how data is managed, analyzed, and used to support decision-making.
| Stage | Question it answers | Typical tools used |
| Descriptive | What happened? | Basic dashboards |
| Diagnostic | Why did it happen? | Drill-downs, data exploration |
| Predictive | What will happen? | Forecasting, machine learning |
| Prescriptive | What should we do? | Optimization, AI-driven recommendations |
| Cognitive (emerging) | Can the system decide and act for us? | AI agents, automated decisioning |
Stage 1: Descriptive analytics
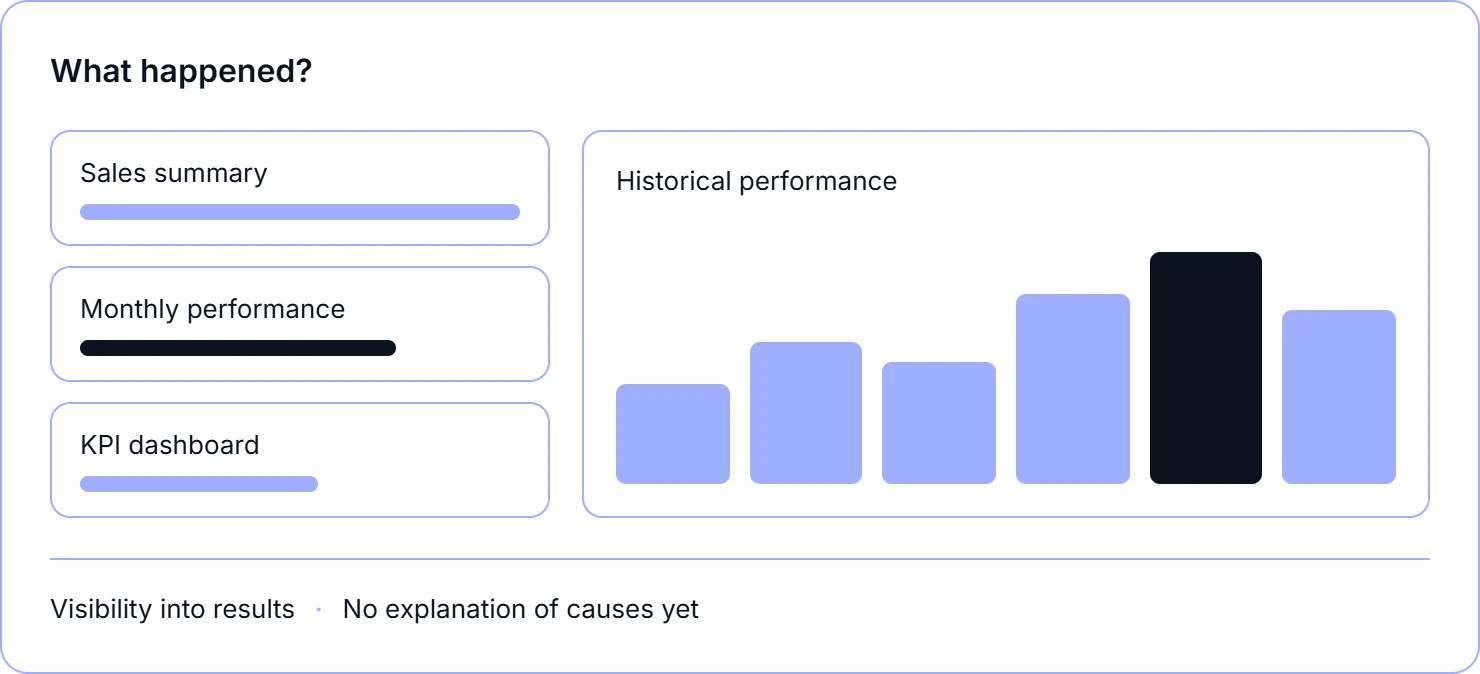
Descriptive analytics is the foundation of the model. It summarizes historical data through dashboards to answer, “What happened?”. Most organizations start here, with sales summaries, monthly performance insights, and basic KPI dashboards. It provides visibility, but on its own, it doesn’t explain the reasons behind performance.
Stage 2: Diagnostic analytics
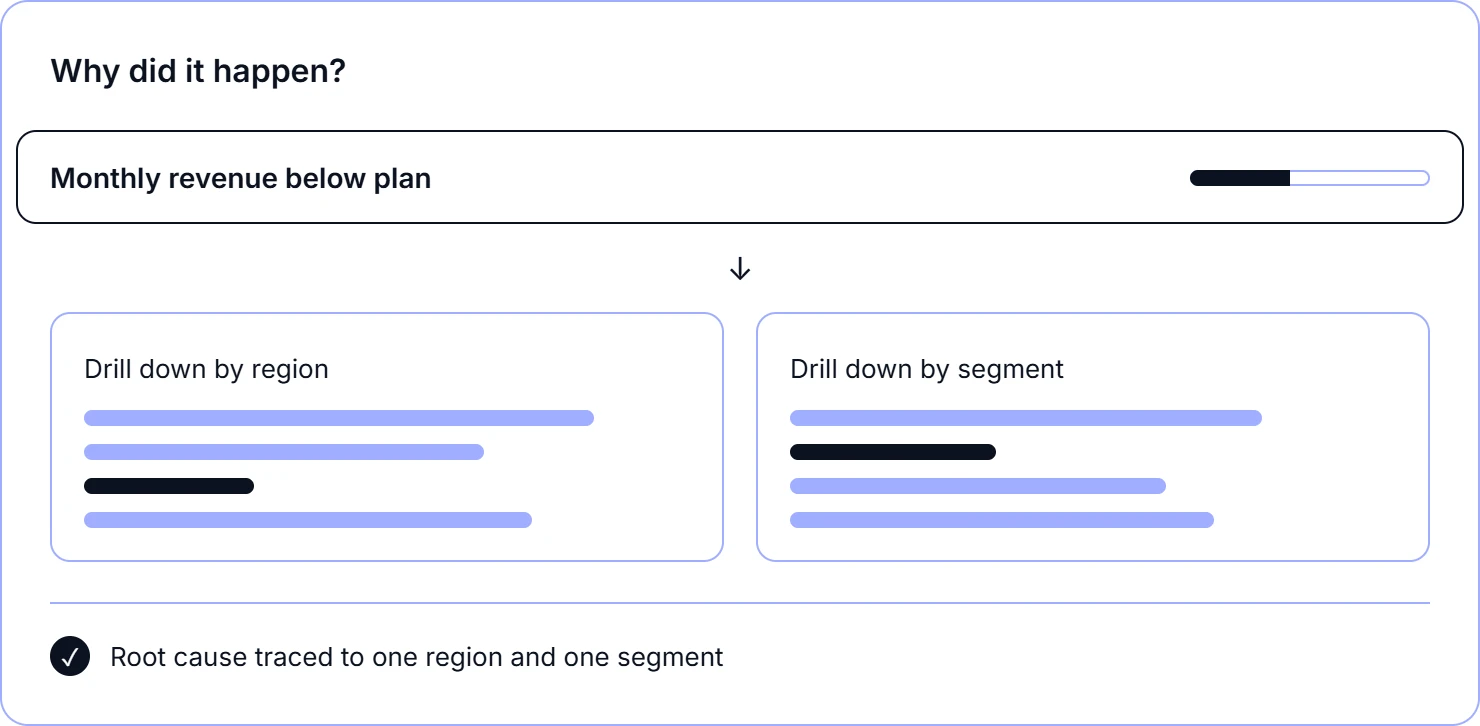
Diagnostic analytics explores why something happened, using drill-downs, filters, and root-cause analysis to connect outcomes to their drivers. For example, a drop in monthly revenue might lead a team to explore data by region or customer segment to pinpoint the cause.
Stage 3: Predictive analytics
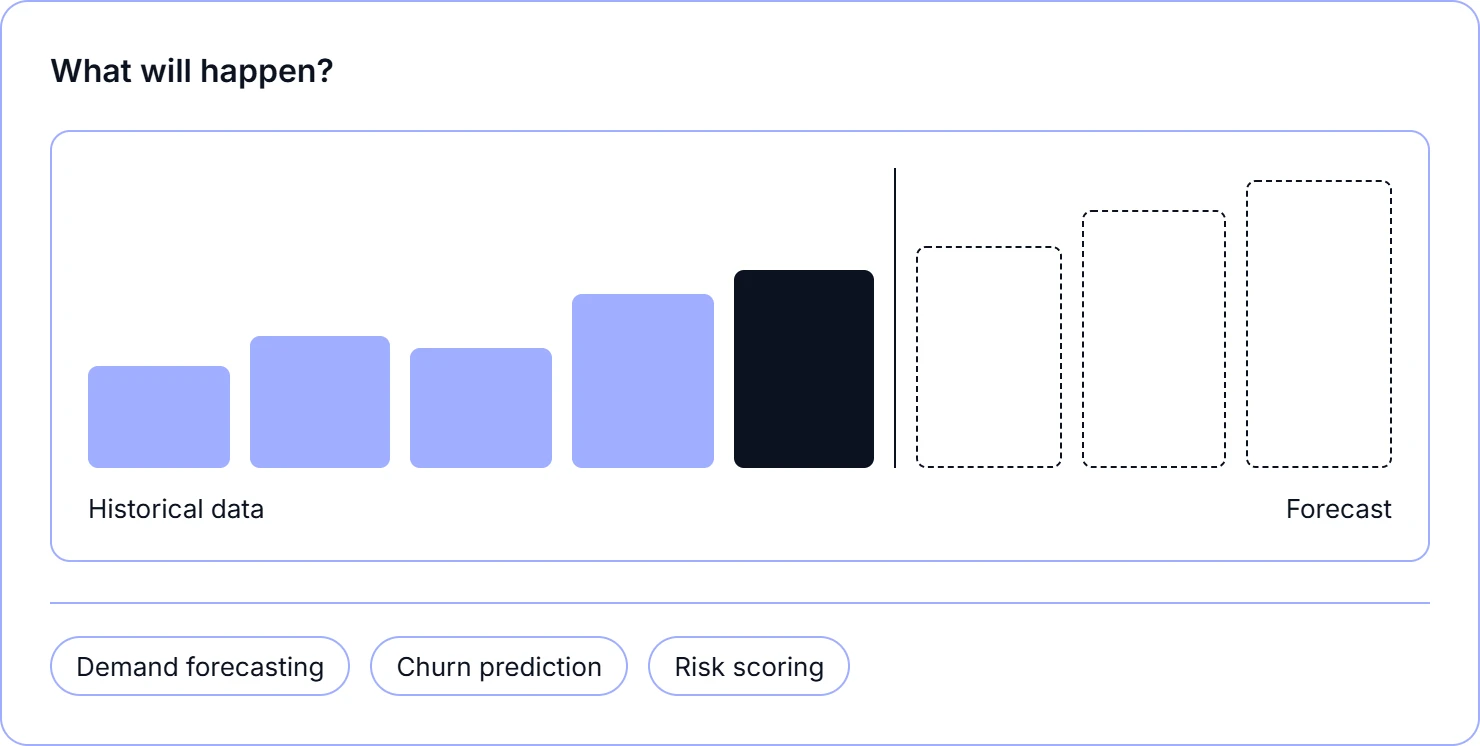
Predictive analytics uses historical data, statistics, and machine learning to estimate what is likely to happen next, moving from looking backward to looking forward. Common examples include demand forecasting, churn prediction, and risk scoring. It requires cleaner data and more advanced tooling than the earlier stages.
Stage 4: Prescriptive analytics
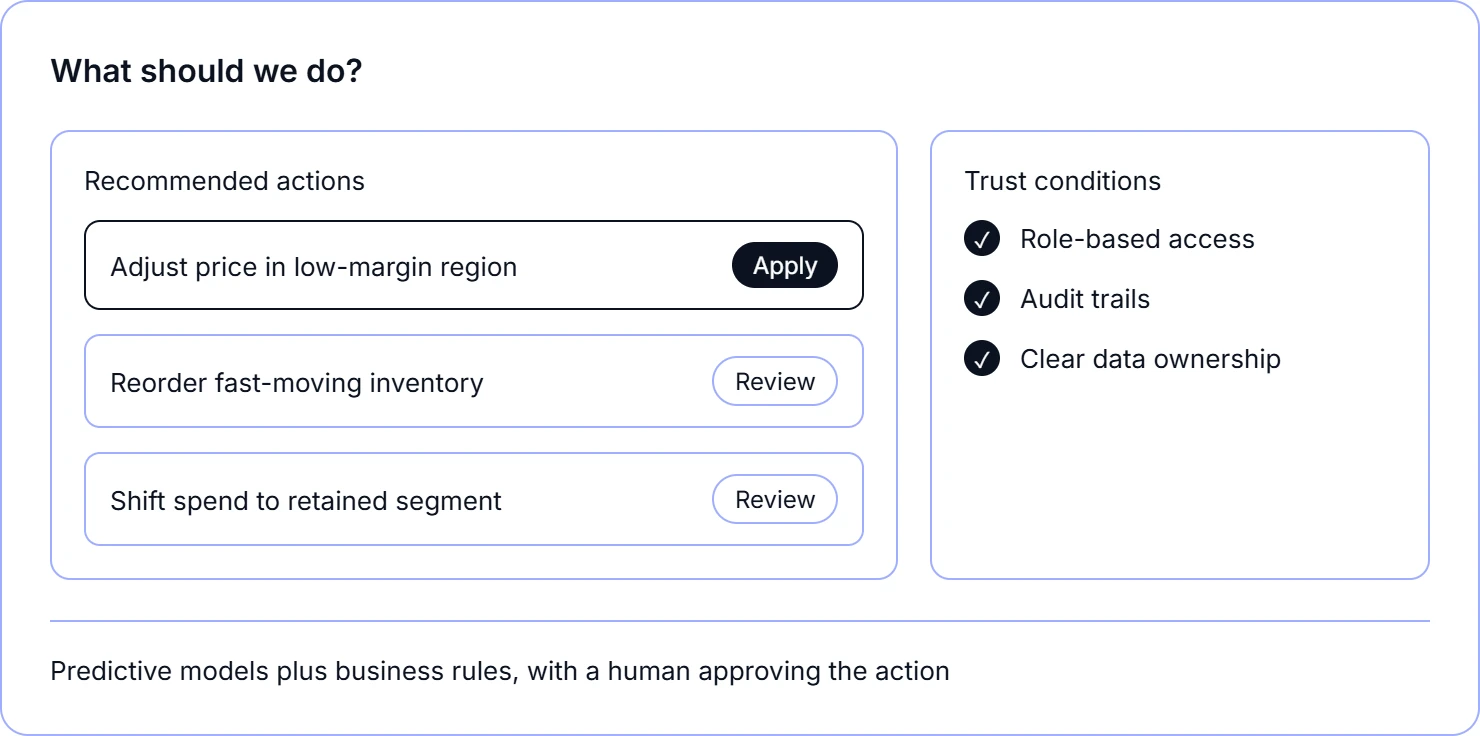
Prescriptive analytics is the most advanced stage in the classic model. It doesn’t just predict outcomes, it recommends or automates the best action to take. This stage often combines predictive models with business rules and, increasingly, AI, such as dynamic pricing and automated inventory recommendations.
Reaching it requires strong data governance and reliable predictive models. In practice, this means role-based access, audit trails, and clear ownership over which data feeds which decision, so leaders can trust the recommendation before acting on it.
Stage 5: Cognitive and AI-driven analytics
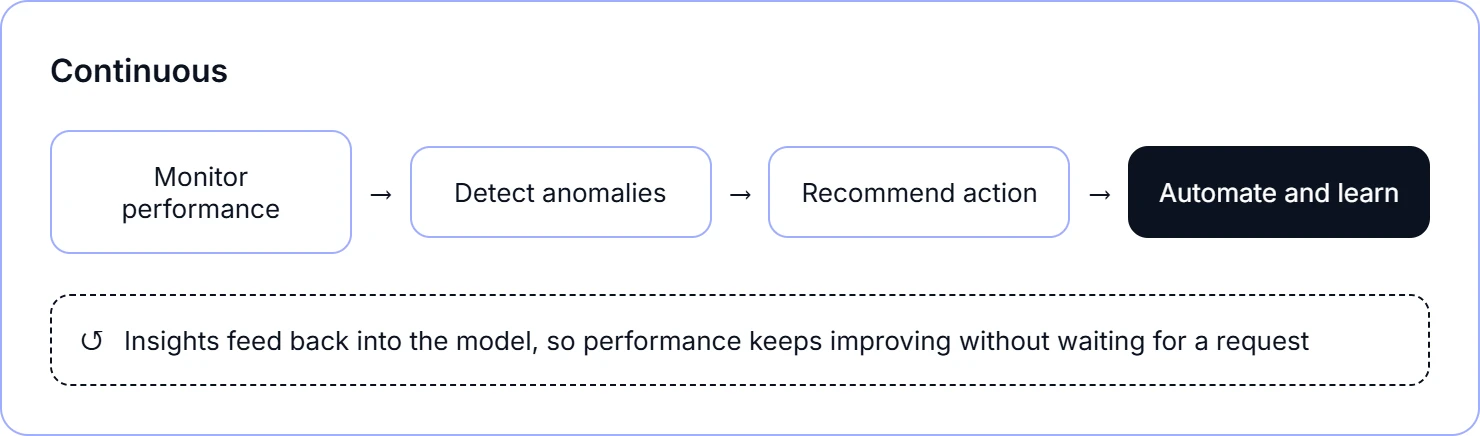
At the highest level of maturity, analytics becomes an active participant in decision-making. AI and machine learning continuously monitor business performance, detect anomalies, explain the likely causes behind changes, recommend corrective actions, and automate defined processes when thresholds are met. Rather than waiting for users to discover issues, analytics proactively surfaces opportunities and risks, helping organizations move closer to autonomous, insight-driven operations.
Is the model a strict roadmap?
It’s tempting to view the analytics maturity model as a linear progression from stage 1 to stage 5, but the stages are additive, not replacements. Organizations typically continue using capabilities from earlier stages even as they adopt more advanced analytics.
Key things to remember:
- The stages build on one another: Descriptive analytics provides the foundation for diagnostic analytics, which supports predictive and prescriptive analytics.
- Earlier stages remain important: Organizations continue to use descriptive and diagnostic analytics even after adopting advanced analytics capabilities.
- Strong foundations matter: Reliable analytics, quality data, and governance are essential before moving to predictive, prescriptive, or AI-driven analytics.
- Skipping stages can create challenges: Investing heavily in AI or advanced analytics without addressing data quality and analytics gaps can lead to unreliable outcomes.
- Progress should be gradual: Organizations often achieve better results by strengthening existing capabilities before introducing more advanced analytics initiatives.
A more useful mindset is foundation-building. Descriptive analytics supports diagnostic analytics, which in turn supports predictive and prescriptive work. Skipping ahead to invest heavily in AI-driven tools while basic analytics is still unreliable tends to produce shaky results. Strengthening the foundation first, then adding capability on top, generally works better than chasing the most advanced stage right away.
How to assess your organization’s analytics maturity
To determine where your organization stands, you need a structured analytics maturity assessment that evaluates your data, technology, people, and processes. The following areas help determine your analytics maturity level.
1. Data quality: can your organization trust its data?
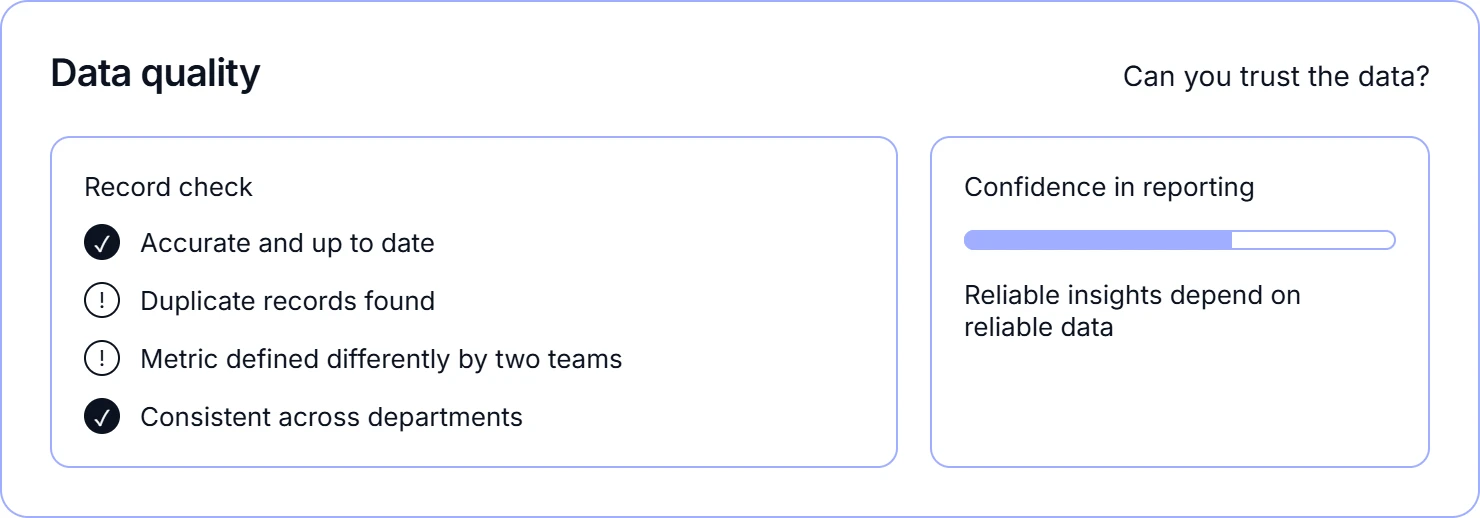
Data is the foundation of every analytics initiative. If data is inaccurate, inconsistent, or incomplete, even the most advanced analytics tools will produce unreliable insights.
When assessing data quality, consider:
- Whether data is accurate and up to date.
- The presence of duplicate or conflicting records.
- Consistency of metrics across departments.
- Overall confidence in analytics outputs.
Organizations with high analytics maturity prioritize data quality because reliable insights depend on reliable data.
2. Analytics infrastructure: do your tools support growth?
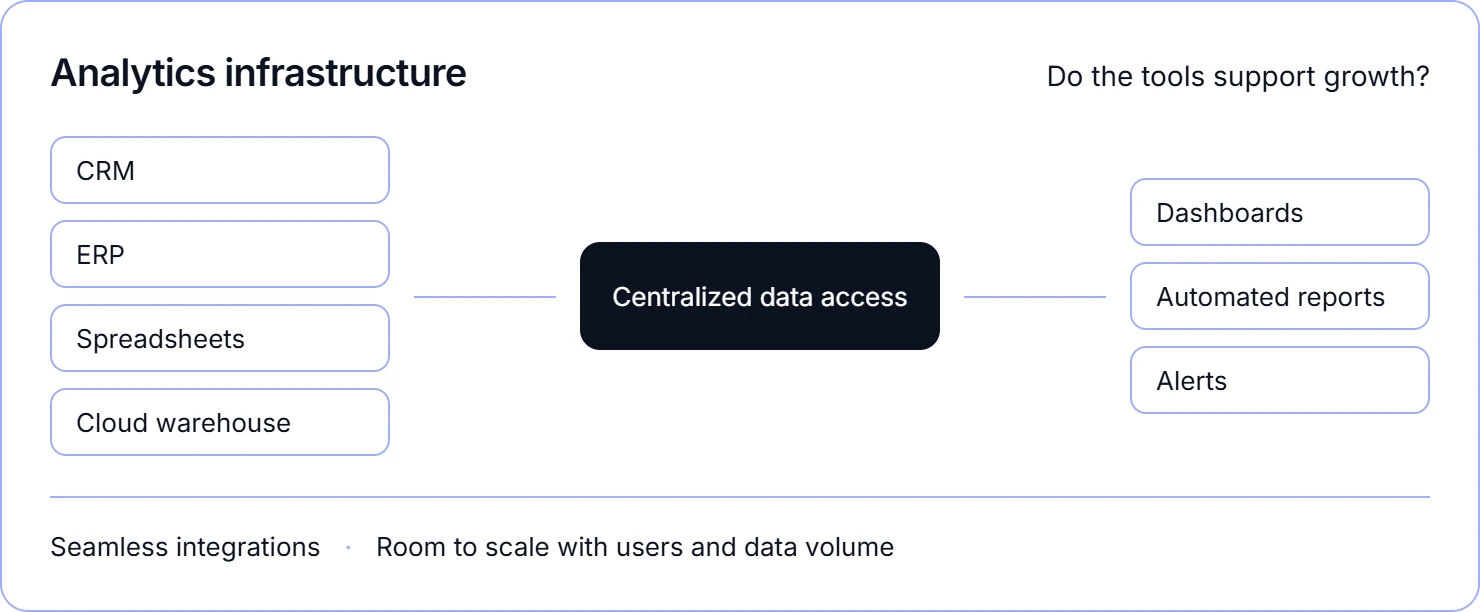
As organizations scale, analytics systems must be able to handle increasing data volumes, users, and analytics requirements.
Evaluate whether your current infrastructure provides:
- Centralized data access.
- Seamless integrations across systems.
- Automated analytics capabilities.
- Scalability for future growth.
A mature analytics environment reduces complexity and enables teams to access insights without technical barriers.
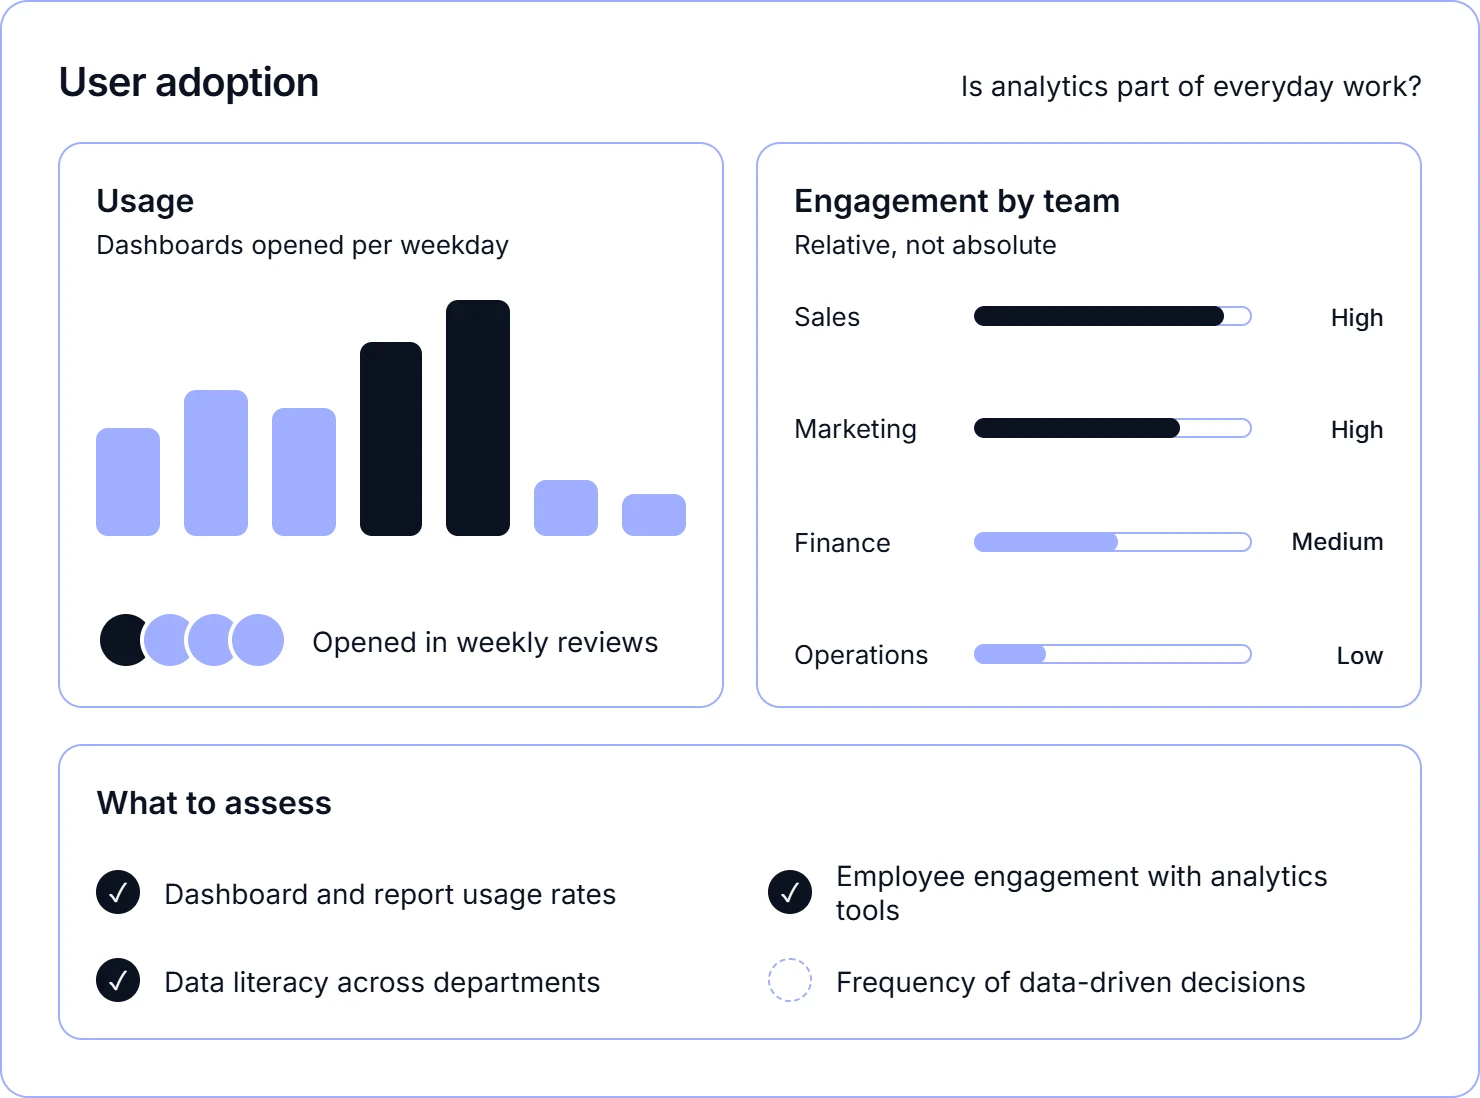
3. User adoption: are teams actively using analytics?
Analytics only creates value when employees use it to make decisions. Even the most sophisticated dashboards have little impact if adoption is low.
Assess factors such as:
- Dashboard usage rates.
- Employee engagement with analytics tools.
- Data literacy across departments.
- Frequency of data-driven discussions and decisions.
Organizations with higher maturity levels foster a culture where analytics become part of everyday workflows.
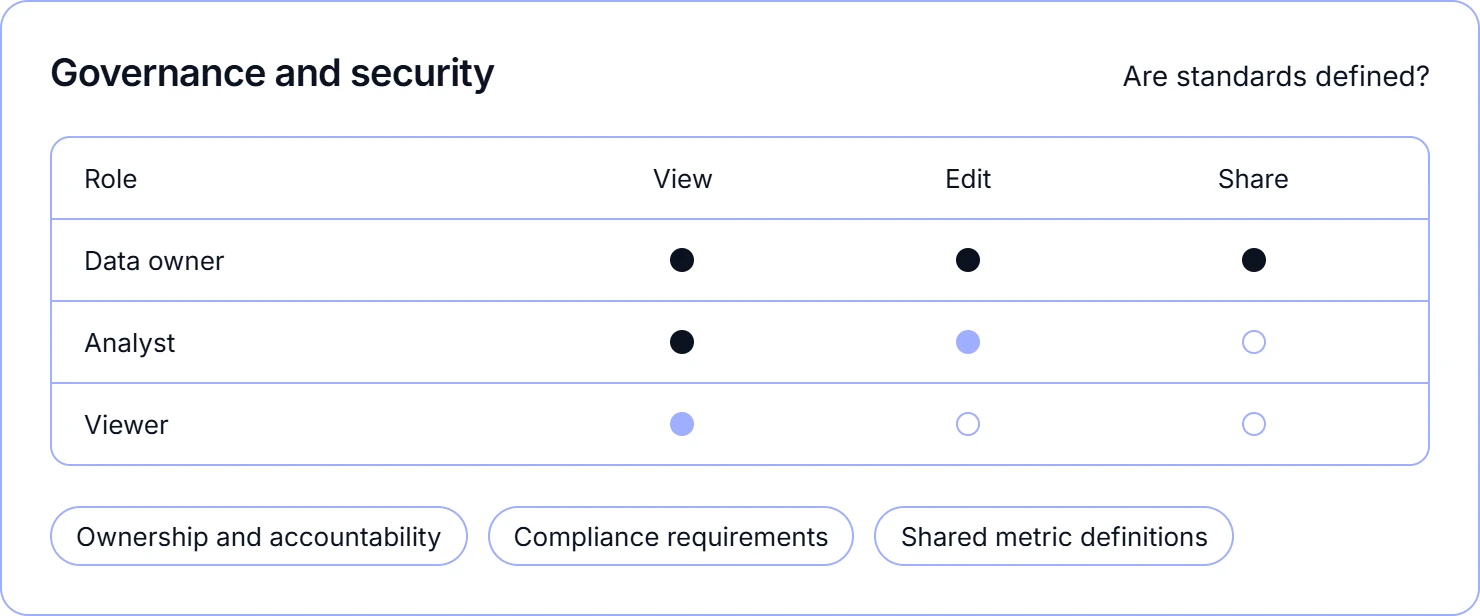
4. Governance and security: are data standards clearly defined?
Strong governance ensures that data remains secure, consistent, and trustworthy across the organization.
Key areas to evaluate include:
- Data ownership and accountability.
- Role-based access controls.
- Compliance and security requirements.
- Analytics standards and definitions.
Without proper governance, organizations often struggle with conflicting dashboards, compliance risks, and reduced trust in analytics.
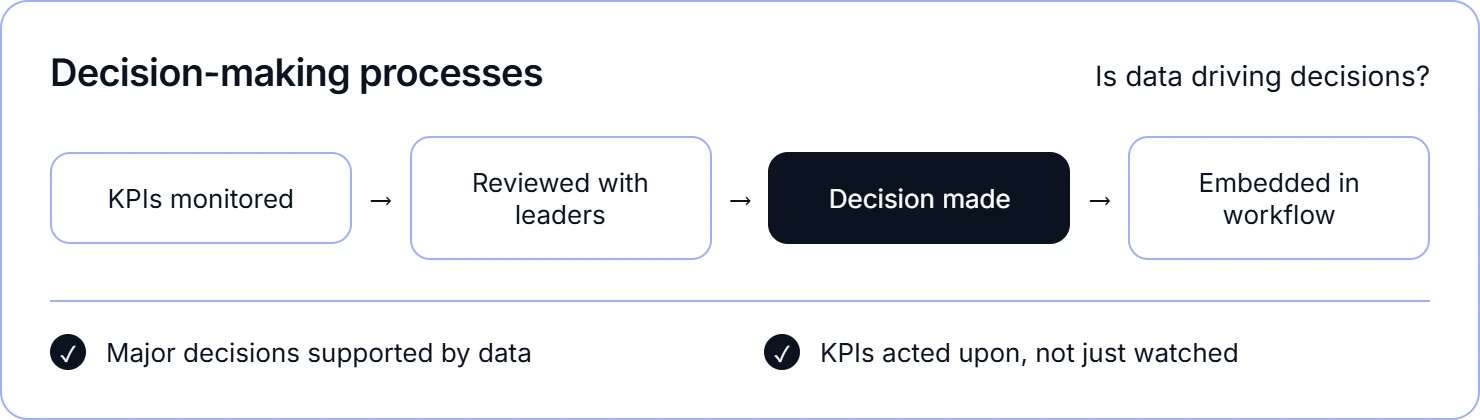
5. Decision-making processes: is data driving business decisions?
The ultimate measure of analytics maturity is how consistent data influences decision-making.
Ask yourself:
- Are major decisions supported by data?
- Do leaders rely on analytics when planning strategies?
- Are KPIs regularly monitored and acted upon?
- Is data embedded into operational workflows?
Organizations with high maturity levels use analytics not only to measure performance but also to guide strategic and operational actions.
Signs you’re stuck at an early analytics maturity stage
Many organizations believe they are further along than they actually are. A few common signs of lower analytics maturity include:
- Dashboards take days to prepare and are outdated by the time they’re shared.
- Business teams rely heavily on IT for basic dashboard requests.
- Data lives in disconnected spreadsheets or systems.
- Decisions rely mostly on gut feeling rather than current data.
- There is no clear owner for data quality or governance.
If several of this sound familiar, your organization has room to grow, and that’s a common starting point.
How to move up the analytics maturity model
Advancing through the analytics maturity model is a gradual process. These steps can help guide the journey.
- Assess your current stage honestly: Review how teams access and use data, and note the biggest delays or gaps.
- Strengthen your data foundation: Clean, connected, well-modeled data makes every later stage easier.
- Give business users self-service access: Reduced dependence on IT for routine analytics frees up time for strategic analysis.
- Adopt AI-powered and predictive tools gradually: Start with forecasting before moving toward automated recommendations.
- Build a data-driven culture: Encourage teams to validate decisions with data, not just instinct.
- Explore cognitive and AI-driven capabilities: Automated decisioning works best on top of reliable data and proven models, not in place of them.
However, putting this plan into practice can be difficult when data is spread across spreadsheets, disconnected tools, and systems that only support part of the analytics journey. Using a platform that unifies data, analytics, and analytics makes it easier to progress through each stage and scale over time. That’s where Bold BI fits in.
How Bold BI supports every stage of your analytics maturity journey
Bold BI is a business intelligence platform designed to help organizations progress through every stage of analytics maturity, from foundational analytics to AI-assisted decision-making. Rather than treating analytics as a single technology purchase, it supports the gradual evolution from trusted analytics and self-service analysis to forecasting, recommendations, and AI-driven insights.
- A reliable data foundation: Bold Data Hub helps you clean, connect, and prepare data before it reaches a dashboard. This is the step most maturity models treat as a prerequisite rather than an optional stage; without it, even advanced AI features end up producing answers nobody fully trusts.
- Descriptive and diagnostic stages: Interactive dashboards and data visualization help teams build clear dashboards and drill into any metric, so a question like “why did regional sales drop last month” can be answered in minutes instead of waiting on a dashboard request.
- Customizable dashboards for every audience: Customizable dashboards let you tailor layouts, branding, and widgets so the same platform works for an executive KPI view and a detailed operational dashboard, without building two separate tools.
- Predictive and prescriptive stages: AI-powered analytics helps teams generate forecasts and surface patterns using natural language and automated insights, so a manager can ask a plain-English question and get a forecast back without writing a query.
- Scaling analytics across teams: Self-service analytics lets business users explore governed data independently, cutting the time between a question and an answer from days to minutes and freeing up IT for higher-value work.
- Extending analytics beyond your team: Embedded analytics lets you bring the same dashboards and AI-powered insights directly into your own product or customer portal, so analytics maturity isn’t limited to internal analytics.
- Enterprise-wide governance: Enterprise analytics and audit trail keep analytics consistent and secure as adoption grows, which matters most at the Prescriptive and Cognitive stages, where decisions increasingly rely on automated recommendations.
While AI can accelerate analysis and decision-making, it doesn’t replace analyst expertise or business judgment. Bold BI maintains transparency by grounding AI-generated insights and recommendations in the underlying data, allowing teams to validate findings, investigate contributing factors, and make decisions with confidence. Seen in practice, this looks like teams across different industries asking plain-English questions and getting grounded, actionable answers back in the moment.
Real-world application
Bold BI® helps several industries move from asking questions about their data to acting on it in the moment, without waiting on an analytics request. The following is an illustrative example, not based on a specific customer, of how the retail industry can use Bold BI to speed up everyday decisions.
Retail industry: monitoring product performance
Scenario: A retail manager needs a quick view of product performance in Brazil before an inventory review.
Problem: Building this view usually means waiting on analytics request or manually creating a dashboard, which slows down time-sensitive decisions.
How Bold BI helps: The manager simply asks, “Show me a bar chart of top 10 products by sales in Brazil.” Bold BI’s AI Assistant processes the request and generates the visualization instantly, letting the manager explore follow-up questions and move straight into inventory planning.
This is just one example. Any industry or department, from finance to marketing to operations, can apply the same approach to bring analytics closer to the moment a decision needs to be made.
Ready to see where Bold BI fits into your analytics journey? Discover how Bold BI helps you evaluate your current analytics capabilities, identify growth opportunities, and create a roadmap for data-driven success. Start a free 30-day trial or schedule a demo to see how Bold BI can accelerate your analytics journey.
Frequently asked questions
-
- 1.
What is the analytics maturity model?
It’s a framework showing how an organization’s use of data evolves, typically through descriptive, diagnostic, predictive, and prescriptive stages, with an emerging fifth stage built around AI.
- 2.
What are the stages of analytics maturity?
The four core stages are descriptive (what happened), diagnostic (why it happened), predictive (what will happen), and prescriptive (what should we do). Some newer versions add a fifth stage, cognitive analytics, where AI systems learn continuously and act with minimal human input.
- 3.
How do I know what analytics maturity stage my company is in?
Look at how teams access data, how fast dashboards are produced, and whether decisions rely on current data or instinct. Frequent delays and manual analytics usually point to earlier stages.
- 4.
Can a company skip stages in the analytics maturity model?
The stages are additive rather than strictly sequential, so teams keep using earlier-stage tools even as they adopt more advanced ones. Skipping straight to predictive, prescriptive, or cognitive tools without a solid data foundation often leads to unreliable results.
- 5.
How does Bold BI help organizations advance their analytics maturity?
Bold BI combines self-service dashboards, governed data modeling, and AI-powered analytics in one platform, helping teams move from basic analytics to predictive and prescriptive insights without switching tools.
- 1.





