

Product Analytics vs. BI: What’s the Real Difference?
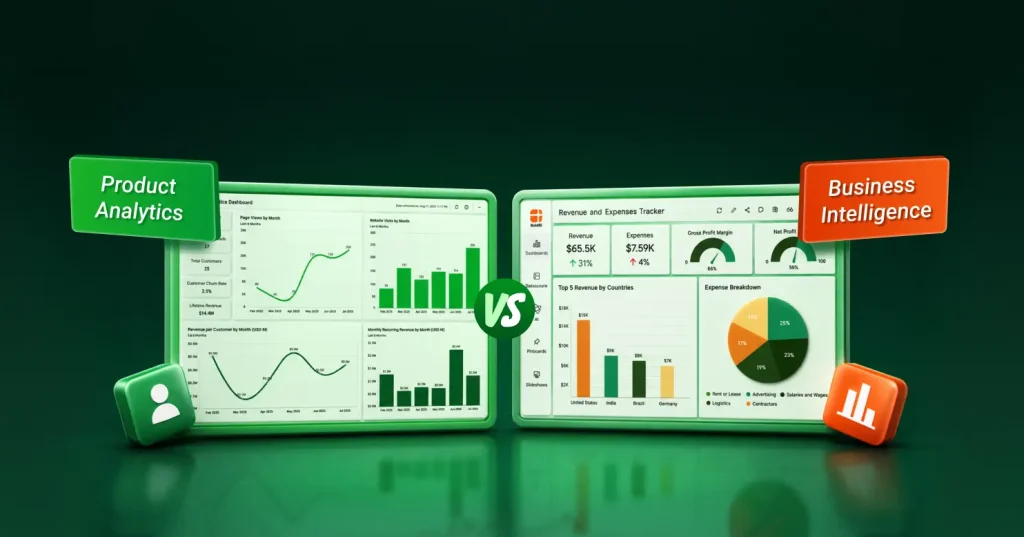
TL;DR: Product analytics tells you what users are doing inside your product. Business intelligence tells you how the business is performing overall. Most growing companies eventually need both, and the two are converging fast. Bold BI® unifies these data sources to link product usage with retention, customer health, and revenue outcomes.
Introduction
Ask a finance manager and a product manager what analytics means, and you’ll likely get two different answers. One thinks about revenue, retention, and business performance. The other thinks about feature adoption, onboarding funnels, and user behavior. Both are correct. They’re simply looking at different layers of the same story.
Business intelligence helps organizations understand overall business performance, while product analytics helps explain the behaviors that often influence those outcomes.
By combining product data with revenue, customer, support, and operational data, BI provides a broader view of business performance.
In simple terms:
- Leadership sees the what, not the why.
- Product teams see the why, not the so what.
This article compares product analytics and business intelligence, explains where they overlap, and helps you determine when your organization needs one, the other, or both.
Why teams end up comparing these in the first place
The two categories usually collide the moment one team hits a question the other’s tool was built to answer. This comparison usually starts because of a specific, painful gap:
- Leadership sees retention dropped last quarter, but the dashboard rolls up numbers from the CRM and billing system and wasn’t built to show users abandoning a specific onboarding step.
- A product team tracks feature usage closely but can’t connect it to revenue impact, because that data lives in a warehouse their product analytics tool never touches.
Both point to the same root cause: using one category of tool to answer a question that belongs to the other team’s usual purview.
What is product analytics?
Product analytics is software built to track and analyze how users interact with a digital product: every click, page view, feature use, and drop-off point is captured as discrete events.
It typically involves:
- Event tracking at the user and session level.
- Funnel and flow analysis to see where users drop off.
- Cohort and retention analytics to track behavior over time.
- Feature adoption metrics tied to specific releases.
These tools are built for exactly this. Tracking every click, every drop-off point, and how a group of users behaves over time is the whole point. Product analytics excels at behavioral analysis.
What is business intelligence?
Business intelligence is software designed to combine and analyze data from across an organization. Instead of focusing on a single application, BI platforms combine information from multiple systems and transform it into dashboards and analytics experiences.
It typically involves:
- Data connectors pulling from CRMs, ERPs, spreadsheets, and warehouses.
- Aggregated dashboards for revenue, costs, pipeline, and KPIs.
- Scheduled and shared dashboards for stakeholders and leadership.
- Cross-functional views that blend data no single team owns alone.
BI tools cannot track clicks or events. They pull data from a warehouse, database, or other system where it already lives, then combine it with everything else the business tracks.
Product analytics vs. business intelligence: Side-by-side comparison
A quick side-by-side comparison of the key differences between product analytics and business intelligence.
| Area | Product Analytics | Business Intelligence |
| Primary focus | User behavior inside a product | Overall business performance |
| Data granularity | Event-level, user-level, session-level | Aggregated, rolled-up, dashboard-level |
| Typical users | Product managers, growth and UX teams | Executives, analysts, finance and ops teams |
| Core question | “What are users doing, and why?” | “How is the business performing?” |
| Data sources | In-app event tracking (SDKs, pixels) | CRM, ERP, warehouses, spreadsheets |
| Time orientation | Often real-time or near real-time | Often retrospective, updated on a cadence |
| Common tools | Amplitude, Mixpanel, Heap, PostHog | Bold BI, Power BI, Tableau, Looker |
| Best fit | Understanding and improving the product experience | Understanding and steering the business as a whole |
The differences that matter most
Five specific distinctions that decide which tool actually answers your question:
1. What the data represents
Product analytics data is behavioral: an event fires every time a user clicks, scrolls, or completes an action. BI data is a summary: total revenue, tickets closed, average deal size.
2. Who’s asking the questions
Product teams use product analytics to improve the in-app experience. Executives and analysts use BI to steer the business. Give the wrong team the wrong tool, and they either get too much irrelevant detail or can’t find the detail they need.
3. How fresh the data needs to be
Product analytics often needs to be near real-time, since a product manager watching a feature launch wants adoption data within hours. BI dashboards are typically refreshed daily, weekly, or monthly.
4. Where the data comes from
Product analytics tools capture their own event data through SDKs embedded in an app. BI platforms typically connect to data that already exists elsewhere, such as a warehouse, a CRM, or a spreadsheet.
How the two are converging
This is all changing. Modern BI platforms increasingly support embedding dashboards inside a product and connecting to usage data, while some product analytics tools now offer BI-style cross-functional analytics. Expect more overlap between the categories in the future.
Signs you need product analytics, BI, or both
Not sure which analytics approach is right for your team? Use this quick checklist to identify the metrics you need.
You need product analytics if:
- You can’t identify where users drop off in their journey.
- You don’t know whether new features are being adopted.
- You lack visibility into user engagement, retention, or churn patterns.
You need business intelligence if:
- You don’t have a single, trusted view of business performance.
- Reporting requires manual data collection and consolidation.
You need both if:
- You know a metric changed but don’t know what caused it.
- You want to connect product usage with business outcomes such as revenue, retention, or customer lifetime value.
- Teams frequently combine product, customer, and financial data to make decisions.
Do you need both?
For most growing companies, the honest answer is yes, eventually. Early-stage teams often start with just one: BI for the basics, or a lightweight product analytics tool if the product experience is the main priority.
Scaling teams typically need both: product analytics to optimize the experience, BI to surface the results.
The link between the two matters more than picking a “winner.” The best insight usually links behavior to outcomes; for example, seeing whether users who finish onboarding faster also tend to renew at a higher rate.
How to start using both together
You don’t need a large upfront project to get value from combining the two. A staged approach works better:
- Name the unanswered question. Start with one specific gap, such as “we don’t know why trial users don’t convert,” rather than trying to fix everything at once.
- Audit what data already exists. Check whether product usage events are already being captured somewhere, even informally, before buying a new tool.
- Connect product data to your BI layer. Pipe usage events into the same warehouse or database your BI platform already connects to, so both data sets live side by side. This is where a platform with broad data connectors, like Bold BI, removes a step: you’re not building a separate integration layer just to get the two data sets talking.
- Build one blended dashboard. Create a starter dashboard. Build a single view that pairs a usage metric with a business metric, like feature adoption next to renewal rate, and see what it surfaces.
- Expand from there. Once one blended view proves useful, extend the same pattern to other teams and metrics instead of building each dashboard from scratch.
How Bold BI closes the gap between product usage and business outcomes
While Bold BI is built for business intelligence and embedded analytics, it goes beyond dashboards. By combining enterprise-wide data visibility with capabilities often associated with product analytics, teams can answer more questions without adding another tool to their stack:
- Embedded analytics lets you deliver usage and performance dashboards directly inside your own application, not in a separate analytics tool.
- Self-service analytics lets product and business teams build and explore their own dashboards without waiting on IT or an analyst.
- Multitenant support gives each customer or team an isolated, secure view of their own usage data, which matters if you’re a SaaS company sharing product analytics back to your own users.
- 140+ data connectors mean Bold BI can pull from the same warehouses and databases where product event data typically lands, alongside your CRM, ERP, and finance systems.
- AI-powered analytics, including a prompt-to-dashboard feature, lets teams ask questions in plain language and get instant visuals, lowering the barrier for product and business teams to explore the same data.
Put together, this means you can connect product data and build blended dashboards within a single platform, reducing the integration effort and licensing costs associated with maintaining a separate product analytics tool alongside your BI stack.
If your team is deciding between a dedicated product analytics tool and extending your BI setup, check the Bold BI pricing and plans or start a free trial to see how far one platform can take you first.
While feature comparisons help evaluate platforms, customer feedback often reveals how those capabilities perform in practice. The following G2 review shows how one organization used Bold BI’s embedded analytics, live data connectivity, and multi-tenant architecture to accelerate implementation and simplify analytics delivery.
Finally, embedded analytics that get out of our way — at a fraction of the cost
Bold BI does the three things our product actually depends on, natively: embedding dashboards directly into our React app, connecting live to MySQL without an intermediate data layer, and keeping each client’s data cleanly isolated through built-in multi-tenancy. Coming from a prior platform where each of those was a fight, the difference has been night and day. The React SDK made embedding straightforward, and features that had eaten months of effort elsewhere came together in days. Support has been a standout too — the team is genuinely responsive and, depending on the complexity of the issue, will jump on a call with multiple engineers rather than trading tickets back and forth for weeks.
Barbara S., Small Business Founder and CEO
This experience highlights how Bold BI can help organizations deploy analytics faster, reduce development effort, and bring customer-facing insights to market more efficiently.
Final thoughts
Product analytics tells you what’s happening inside your product. Business intelligence tells you what that means for the business. The teams that get the most value don’t pick a side. They figure out which questions belong to which category, and they choose tools that let them move between the two without friction.
Ready to see how far a unified analytics platform can go? Start a free trial with Bold BI® or explore the embedded analytics buyer’s guide to compare your options.
Frequently asked questions
-
- 1.
What is the difference between product analytics and business intelligence?
Product analytics focuses on user behavior within a product, while business intelligence analyzes data across the entire business.
- 2.
Is product analytics the same as business intelligence?
No. Product analytics tracks product usage, whereas BI connects product data with broader business metrics.
- 3.
When should a company use product analytics?
Use product analytics to understand user engagement, feature adoption, retention, and customer behavior.
- 4.
When is business intelligence a better choice?
BI is ideal when you need insights from multiple systems, such as sales, finance, operations, and support.
- 5.
Can product analytics and business intelligence work together?
Yes. Together, they provide both product-level insights and a complete view of business performance.
- 6.
What are the limitations of product analytics?
It focuses primarily on product usage and may not show how user behavior impacts overall business results.
- 7.
Why connect product data with business data?
Connecting data sources helps organizations understand how product adoption influences revenue, retention, and growth.
- 8.
Can a business intelligence platform be used for product analytics?
Many BI platforms can visualize product usage data once event data is available. Platforms such as Bold BI can combine product, CRM, support, and financial data in a single environment, helping organizations connect behavior with business outcomes.
- 9.
Does business intelligence replace product analytics?
No. BI complements product analytics by adding business context to product usage data.
- 1.





