

Apriori Algorithm in BI: What It Is and How It Works

TL;DR: The Apriori algorithm finds items that frequently occur together in transactional data. Support, confidence, and lift separate meaningful patterns from coincidence, powering market basket analysis and cross-selling. With Bold Data Hub and Bold BI®, you can schedule Apriori scripts in Python and share the results as interactive dashboards.
Introduction
Most retailers know their best-selling products. Far fewer know which products sell because of each other. Without that insight, promotions rely on assumptions and basket value stays flat.
The same gap exists in banking, healthcare, and subscription businesses, and finding these relationships manually across millions of transactions is not realistic. This is where the Apriori algorithm in BI helps. This guide explains how it works, how to measure rule strength, and how to automate it with Bold Data Hub and Bold BI.
What Is the Apriori Algorithm?
The Apriori algorithm is an unsupervised data mining technique that discovers frequent itemsets, groups of items that often appear together, and turns them into association rules such as “customers who buy X also buy Y.” It is the classic method behind market basket analysis and cross-selling.
Introduced by Rakesh Agrawal and Ramakrishnan Srikant in 1994, Apriori remains popular because its results are easy to explain to non-technical teams.
Key Concepts: Support, Confidence, and Lift
To judge whether a rule is worth acting on, Apriori uses three metrics. Consider these four transactions:
| Transaction ID | Items |
| T1 | Bread, Milk |
| T2 | Bread, Butter |
| T3 | Bread, Milk, Eggs |
| T4 | Milk, Eggs |
We’ll evaluate the rule Bread → Milk.
Support
Support measures how often an itemset appears across all transactions.
Support(Bread, Milk) = Transactions containing Bread and Milk ÷ Total transactions = 2 ÷ 4 = 50%
Confidence
Confidence measures how often the consequent (Milk) appears when the antecedent (Bread) appears.
Confidence(Bread → Milk) = Support(Bread, Milk) ÷ Support(Bread) = 2 ÷ 3 = 67%
In other words, 67% of transactions containing Bread also contain Milk.
Lift
Lift compares confidence with how often the consequent appears anyway.
Lift(Bread → Milk) = Confidence(Bread → Milk) ÷ Support(Milk) = 0.67 ÷ 0.75 = 0.89
- Lift above 1: The items appear together more often than chance (positive association).
- Lift equal to 1: There is no association.
- Lift below 1: The items appear together less often than chance (negative association).
Bread → Milk looks strong on confidence, but its lift of 0.89 shows Milk is simply common in most baskets. Never judge rules on confidence alone.
These metrics judge rules. The Apriori principle explains how candidates are found efficiently.
The Apriori Principle
The algorithm in BI is built on one idea: if an itemset is frequent, all of its subsets must also be frequent. The reverse makes it efficient: if an itemset is infrequent, every larger itemset containing it is infrequent too.
For example, if Bread + Eggs fails the minimum support threshold, Apriori never evaluates Bread + Milk + Eggs. This pruning makes Apriori far more efficient than checking every possible combination of items.
How the Apriori Algorithm Works
Here is the process on the same four transactions, with a minimum support threshold of 50%.
Step 1: Count Items and Keep Frequent Ones
The algorithm scans every transaction and counts each item.
| Item | Frequency | Support | Result |
| Bread | 3 | 75% | Keep |
| Milk | 3 | 75% | Keep |
| Eggs | 2 | 50% | Keep |
| Butter | 1 | 25% | Remove |
Butter falls below the threshold and is removed.
Step 2: Generate Candidate Pairs
The remaining items are combined into candidate pairs: Bread + Milk, Bread + Eggs, and Milk + Eggs.
Step 3: Prune Infrequent Itemsets
| Itemset | Support | Result |
| Bread + Milk | 50% | Keep |
| Bread + Eggs | 25% | Remove |
| Milk + Eggs | 50% | Keep |
Because Bread + Eggs is infrequent, the three-item set Bread + Milk + Eggs is never evaluated. This is the Apriori principle in action.
Step 4: Generate Association Rules
Rules are created from the frequent itemsets. Take Eggs → Milk:
- Support: 2 ÷ 4 = 50%
- Confidence: 2 ÷ 2 = 100%
- Lift: 1.00 ÷ 0.75 = 1.33
Unlike Bread → Milk, the lift above 1 confirms a genuine positive association.
Step 5: Keep Rules That Meet Your Thresholds
Only rules that meet your minimum confidence and lift thresholds are retained.
Why the Apriori Algorithm Matters for Business Decisions
With the mechanics clear, here is how association rules drive decisions:
- Smarter bundles: Promote product pairs based on evidence, not assumptions.
- Better layouts: Place associated products near each other in aisles or on product pages.
- Relevant recommendations: Feed high-lift rules into recommendation engines and offers.
- Customer understanding: See which products or behaviors cluster together by segment.
- Measurable results: Track the metric a rule should move, such as attach rate or average order value.
Real-World Applications of the Apriori Algorithm
Apriori applies wherever transactions or events can be grouped. The examples below are illustrative.
Retail and E-Commerce Cross-Selling
Healthcare Analytics
Financial Services
Limitations of Apriori and When to Use Alternatives
Apriori is not the right tool for every dataset. Its simplicity brings trade-offs as data grows:
- Processing time: It scans the database once per itemset size, so run time rises with larger baskets.
- Candidate growth: On dense or high-dimensional data, candidate itemsets and rules multiply quickly.
- Memory use: Large candidate sets can consume significant memory.
For very large or dense datasets, FP-Growth or Eclat is often a better fit. The table below shows how the three compare.
| Feature | Apriori | FP-Growth | Eclat |
| Search approach | Breadth-first, level by level | Pattern growth on a compressed tree | Depth-first on vertical item lists |
| Database scans | One per itemset size | Two | Typically one |
| Candidate generation | Required | Not required | Yes, via item list intersections |
| Memory use | Grows with candidate sets | Usually lower; the tree can grow on sparse data | Can be high with long item lists |
| Speed on large data | Slower | Typically faster | Typically faster on dense data |
| Ease of explaining | High | Moderate | Moderate |
| Best fit | Small to medium datasets, teaching | Large datasets | Dense datasets |
Sources: Agrawal and Srikant (1994); Han, Pei, and Yin (2000); Zaki (2000).
Best Practices for Apriori Analysis
Start with thresholds. Support set too high hides valuable niche associations; set too low, it floods results with low-value rules. Begin with moderate values, review the output, and adjust.
From there:
- Judge rules on lift, not confidence alone. The Bread → Milk example showed.
- Clean the data first by removing noisy or irrelevant transactions.
- Keep only rules someone can act on, and validate them against real outcomes such as attach rate or basket value.
- Re-run the analysis on a schedule and track how rules change over time.
Apriori Algorithm Example Using Python
This script uses the open-source mlxtend library to generate rules from the sample data and load them into Bold Data Hub.
import pandas as pd
from mlxtend.preprocessing import TransactionEncoder
from mlxtend.frequent_patterns import apriori, association_rules
transactions = [

["Bread", "Milk"],

["Bread", "Butter"],

["Bread", "Milk", "Eggs"],

["Milk", "Eggs"],

]


te = TransactionEncoder()

basket = pd.DataFrame(te.fit(transactions).transform(transactions), columns=te.columns_)


frequent = apriori(basket, min_support=0.5, use_colnames=True)

rules = association_rules(frequent, metric="lift", min_threshold=1.0)

# Item sets don't load cleanly into database tables, so convert them to text

for col in ["antecedents", "consequents"]:

rules[col] = rules[col].apply(lambda s: ", ".join(sorted(s)))

pipeline.run(rules[["antecedents", "consequents", "support", "confidence", "lift"]],

table_name="apriori_rules")
The script keeps Eggs → Milk and Milk → Eggs (both with a lift of 1.33) and filters out Bread → Milk (lift 0.89).
Bold Data Hub provides the pipeline object at run time. To test locally, replace the last line with print(rules).
Automating Apriori with Bold Data Hub and Bold BI
Notebooks suit exploration, but emailing exported results breaks down as more teams rely on them. Bold Data Hub solves this by running your Python script as a scheduled pipeline, loading the results into a managed data store, and automatically creating a Bold BI data source from the output.
Trade-off: The workflow requires Python to be configured on the server, and it refreshes on a schedule you define rather than streaming transactions continuously.
Prerequisites
- Bold BI with Bold Data Hub available.
- A destination data store configured in the Data Store settings.
- Python on the server. On Windows, Bold Data Hub requires Python 3.13 (64-bit); set a custom installation path in the ETL service’s appsettings.json file.
- The required packages installed: pip install pandas mlxtend
Steps to Run the Script
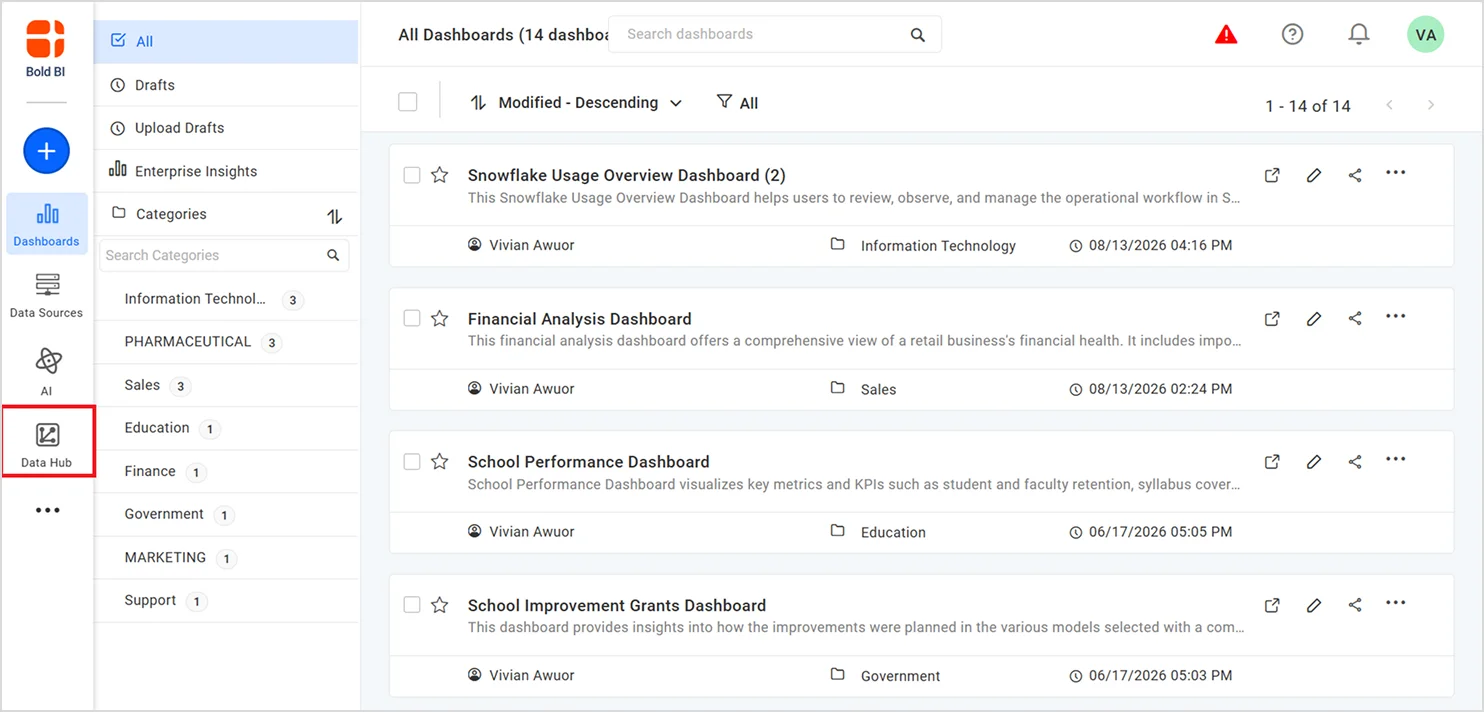
1. Open Bold Data Hub: In Bold BI, click the Bold Data Hub icon in the navigation menu.
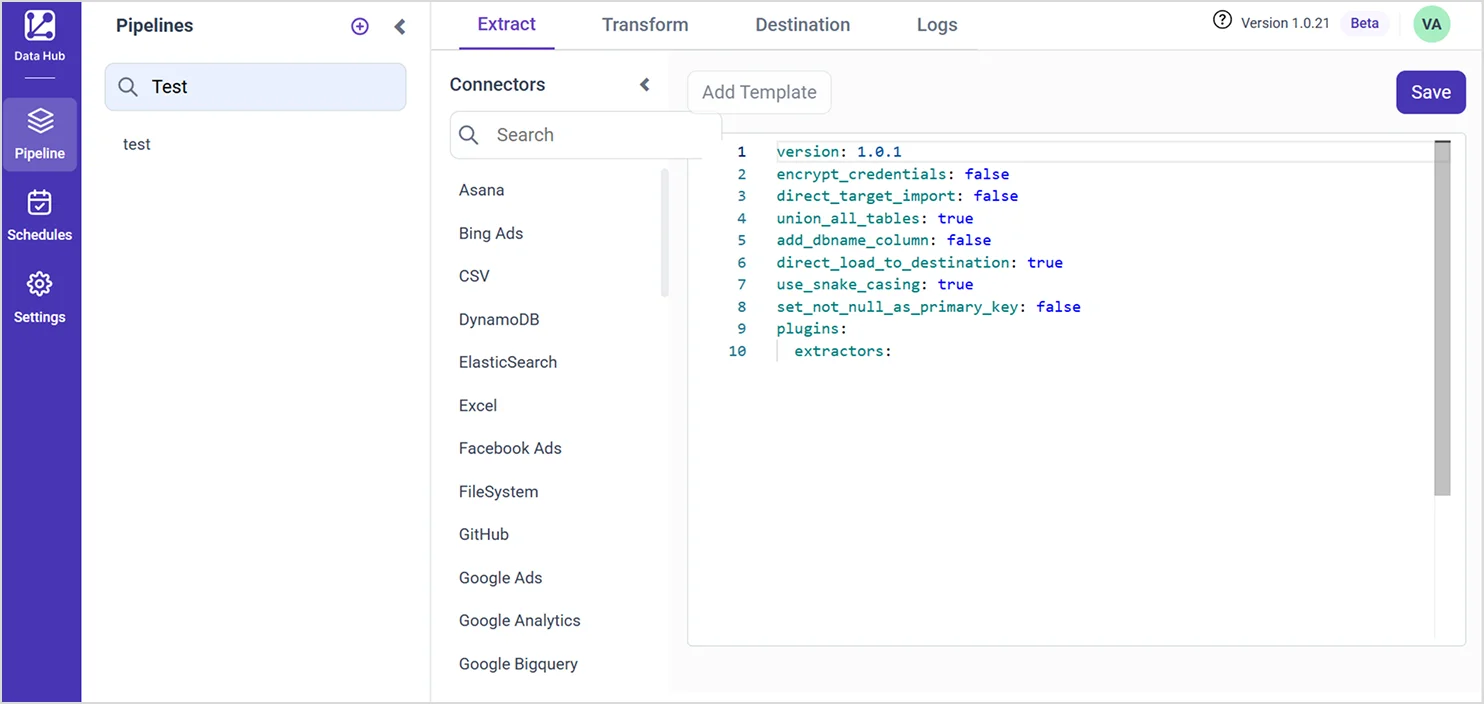
2. Create a pipeline: Click Add Pipeline and enter a name, such as apriori_rules.
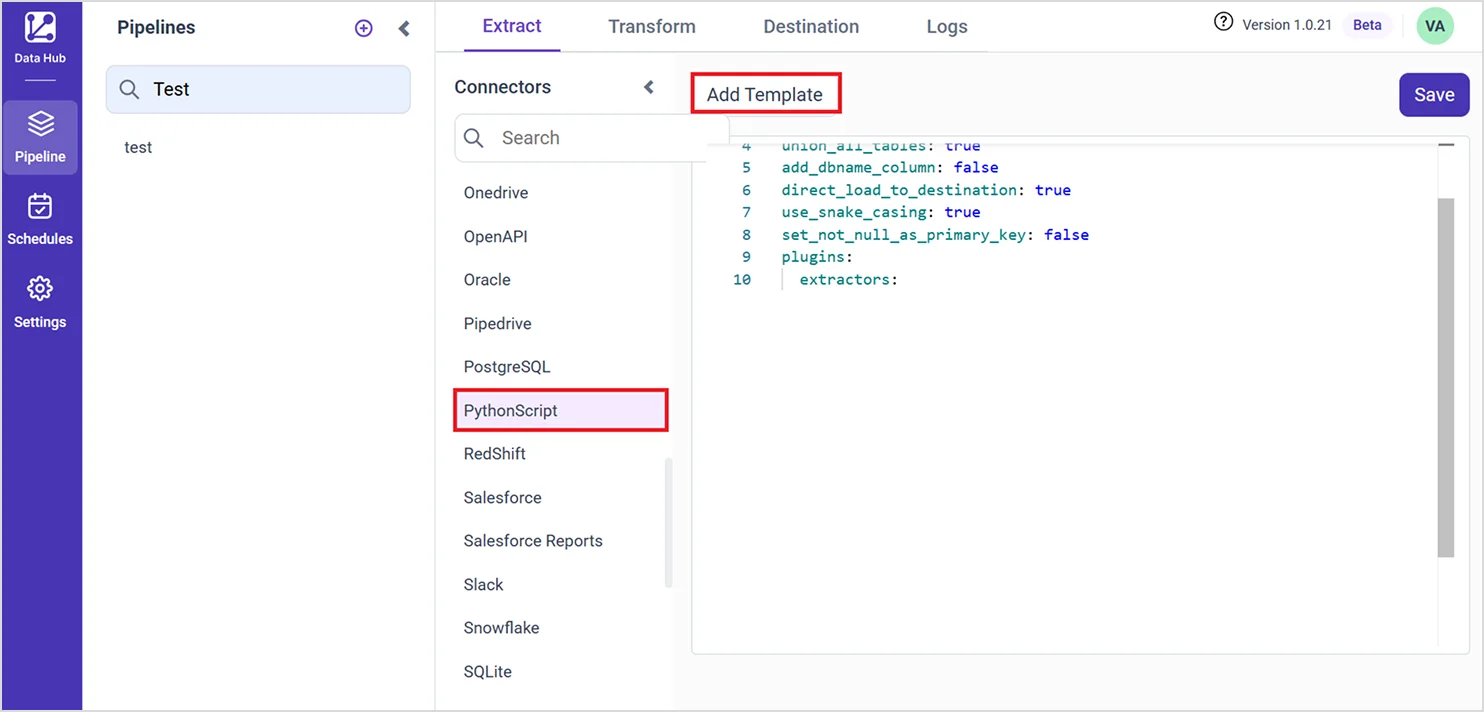
3. Add the Python template: Select the pipeline to open the YAML editor, choose the PythonScript template, and click Add Template.
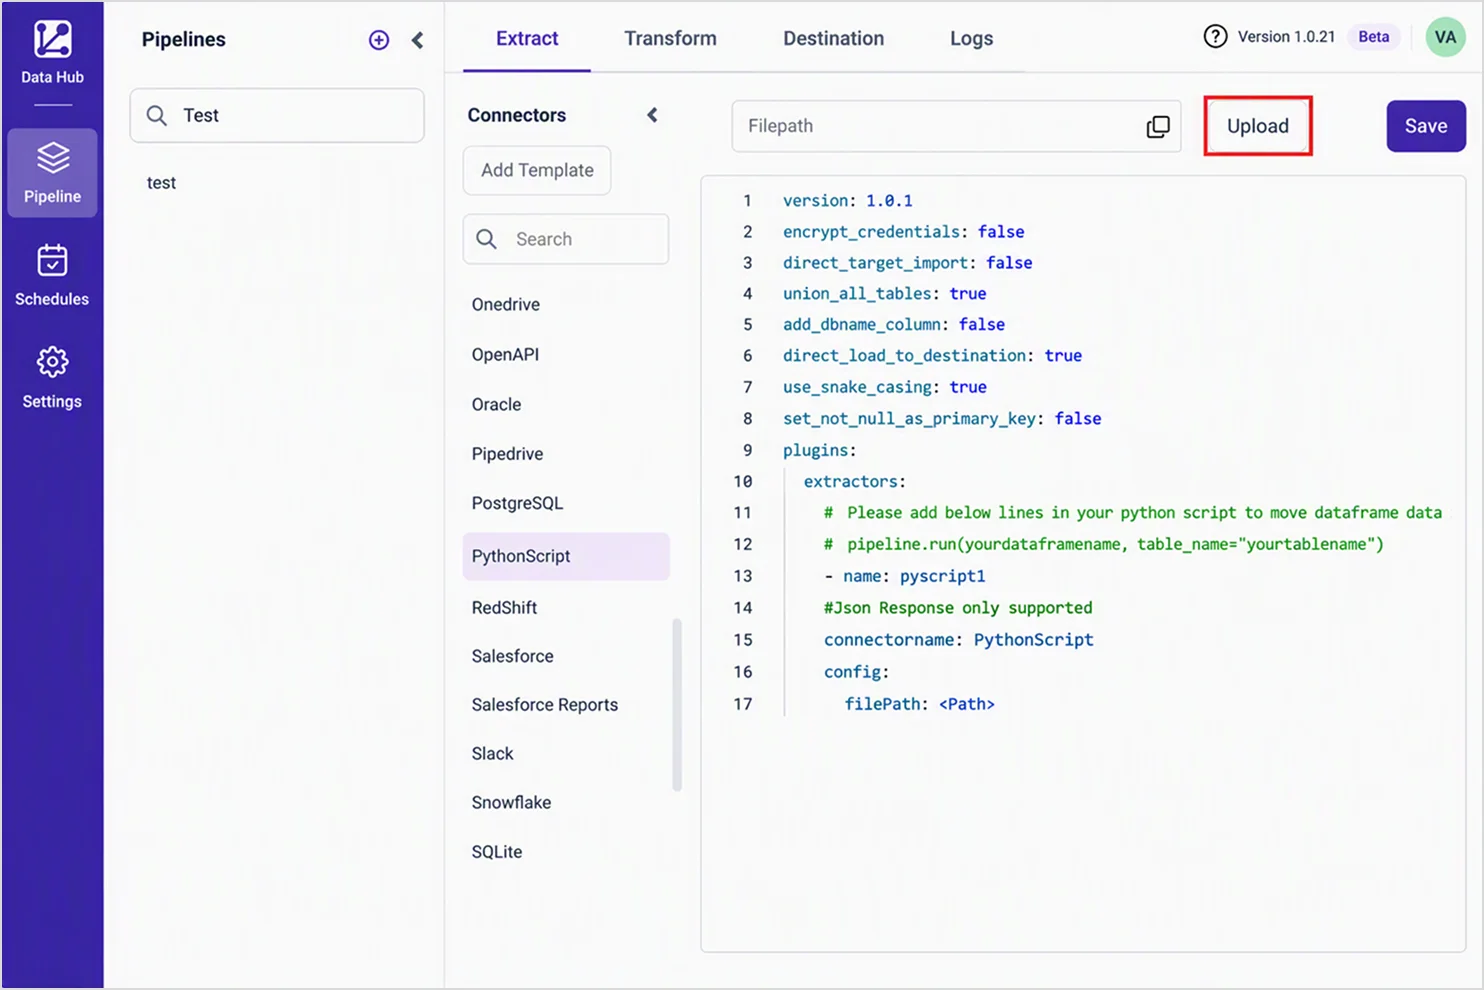
4. Upload your script: Click Upload File, choose your .py file, and paste the generated file path into the YAML configuration.
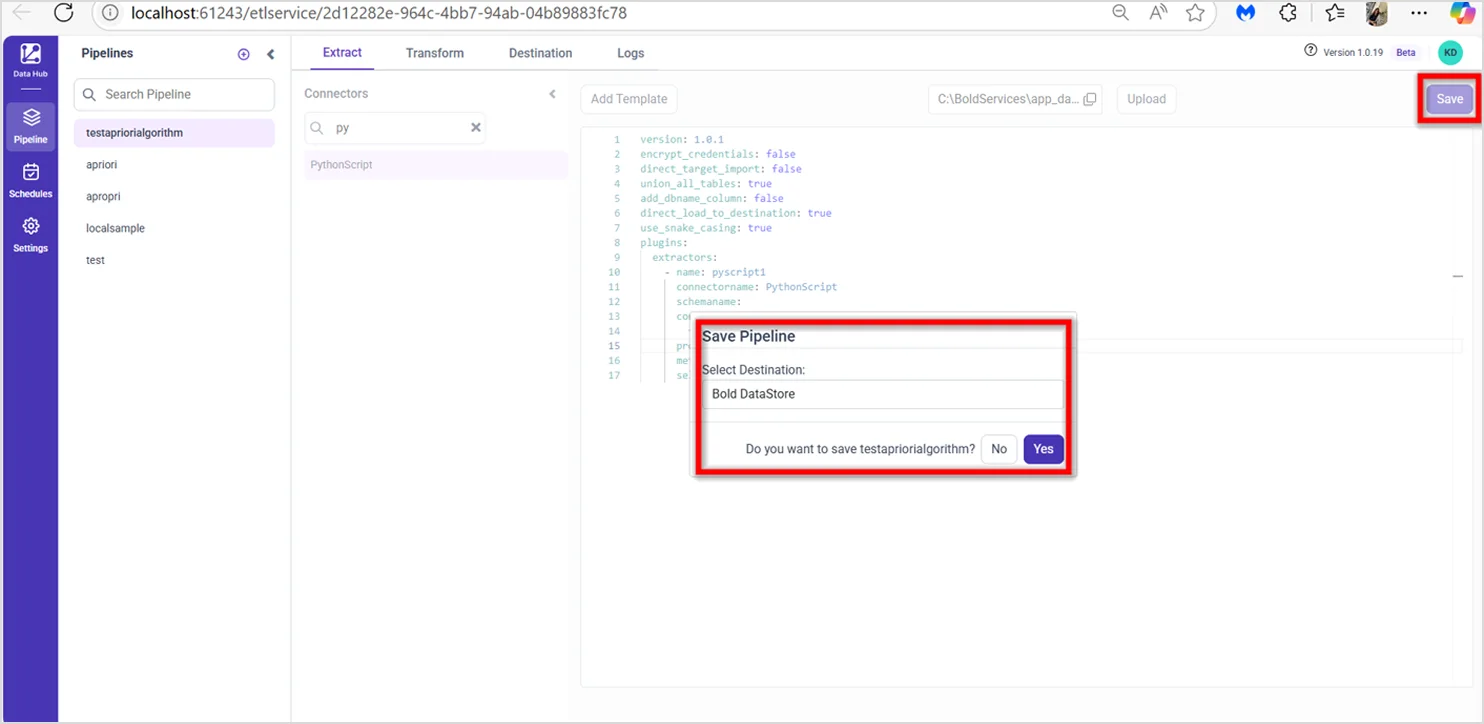
5. Save and choose a destination: Click Save and select the destination data store.
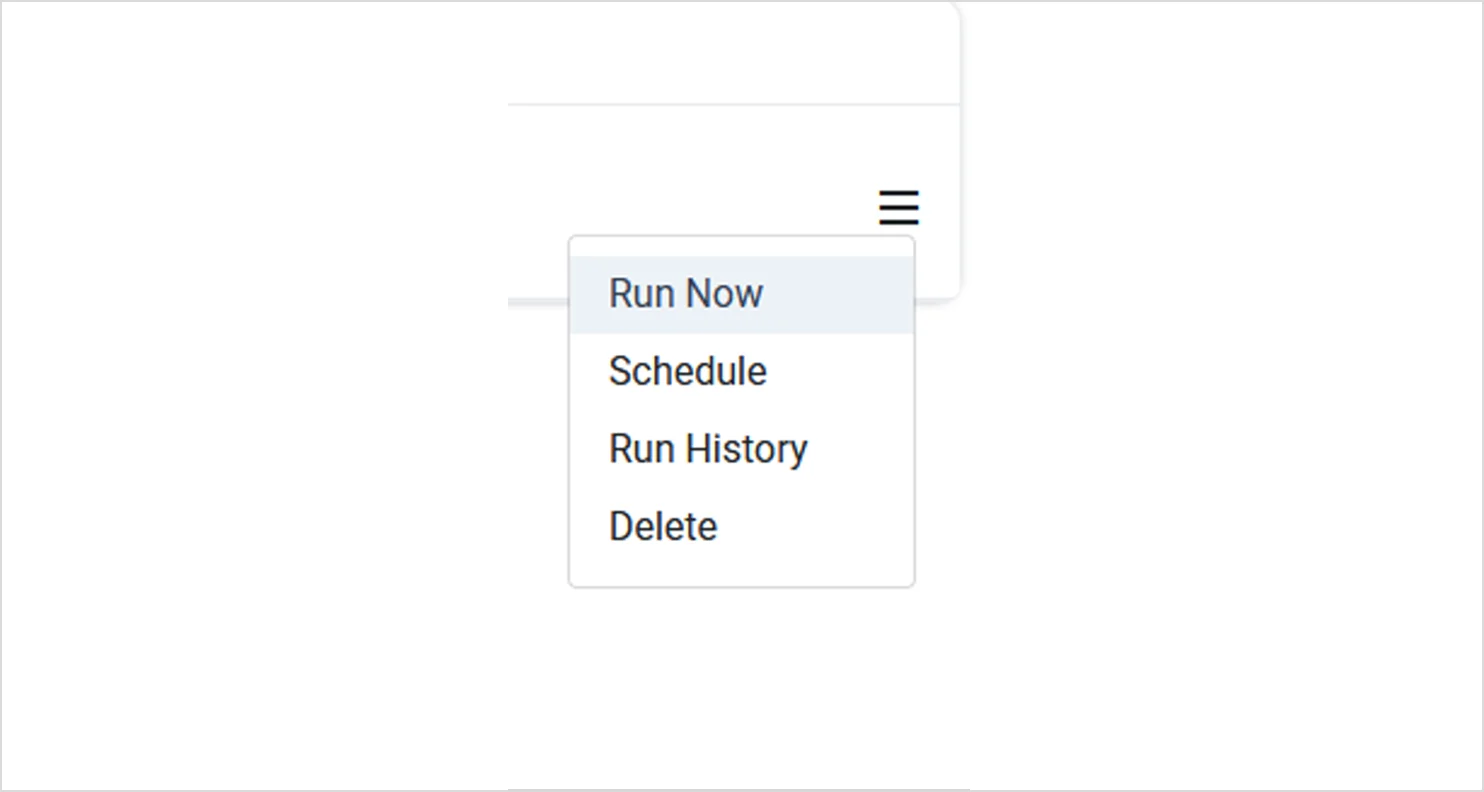
6. Run and schedule: Open Schedules, click Run Now, and check the logs. Then set an interval schedule for automatic refreshes.
7. Confirm the data source: Bold Data Hub creates a Bold BI data source named after your pipeline, connected to the destination table.

For more detail, see the Bold Data Hub documentation and this step-by-step knowledge base article.
Building an Apriori Dashboard in Bold BI
Using the new data source, you can build a dashboard in the Bold BI dashboard designer that helps teams move from rules to decisions. A practical layout includes:
- KPI cards: Total rules discovered, highest lift, and average confidence.
- Support vs. confidence scatter plot: Each point is a rule, sized by lift.
- Rules table: Antecedent, consequent, support, confidence, and lift.
- Product-pair heatmap: The strongest associations across categories.
- Filters: Category, region, or store. Run the script per segment and add the segment as an output column to enable these.
Explore Rules with the Bold BI AI Assistant
Once the dashboard is live, teams can ask the Bold BI AI Assistant questions in plain language instead of building filters or queries. For example:
- Which product pairs have a lift above 1.2?
- Which rules have the highest confidence in the beverages category?
- Which products appear in the most rules?
Why Use Bold BI for Apriori Analysis?
- Always current: Scheduled refreshes replace manual exports.
- Accessible to everyone: Once the pipeline is set up, anyone viewing the dashboard can explore rules through self-service analytics, without SQL or Python.
- Shared and governed: Every team works from the same rules table, not competing spreadsheets.
Turn Association Rules into Action
The Apriori algorithm can uncover valuable relationships hidden inside transactional data, but discovering patterns is only the first step. To maximize business impact, organizations need a way to operationalize, monitor, and communicate those insights across teams. With Bold Data Hub, you can automate Apriori workflows, schedule execution, and load results into managed data stores. With Bold BI®, you can transform those outputs into interactive dashboards that help stakeholders understand customer behavior, identify cross-selling opportunities, and drive data-informed decisions.
Start a 30-day free trial or request a personalized demo to see how Bold BI provides a scalable framework for converting data into decisions.
Frequently Asked Questions
- 1.
What is the Apriori Algorithm?
The Apriori Algorithm is a data mining technique used to identify frequent itemsets and generate association rules from transactional datasets.
- 2.
What is Market Basket Analysis?
Market Basket Analysis identifies products or services that are frequently purchased together and helps organizations improve recommendations, promotions, and product placement.
- 3.
What are Support, Confidence, and Lift?
Support measures frequency, confidence measures reliability, and lift evaluates the strength of an association beyond random occurrence.
- 4.
Can Apriori Results Be Visualized in Bold BI?
Yes. Apriori outputs can be loaded through databases, APIs, data warehouses, or Bold Data Hub pipelines and visualized through interactive analytics dashboards in Bold BI.
- 5.
How Can I Run Apriori Python Scripts Using Bold Data Hub?
Upload the Python script to a Bold Data Hub pipeline, configure the required YAML settings, execute the workflow, and load the generated results into your destination database and Bold BI.
- 6.
What Industries Benefit from Apriori Analysis?
Retail, e-commerce, healthcare, banking, insurance, manufacturing, and telecommunications organizations commonly use Apriori for pattern discovery and customer behavior analysis.
- 7.
What Is the Difference Between Apriori and FP-Growth?
Apriori generates candidate itemsets through repeated database scans, while FP-Growth uses a compressed tree structure that typically performs faster on very large datasets.





