

Embedded Analytics Architecture: Components & Best Practices
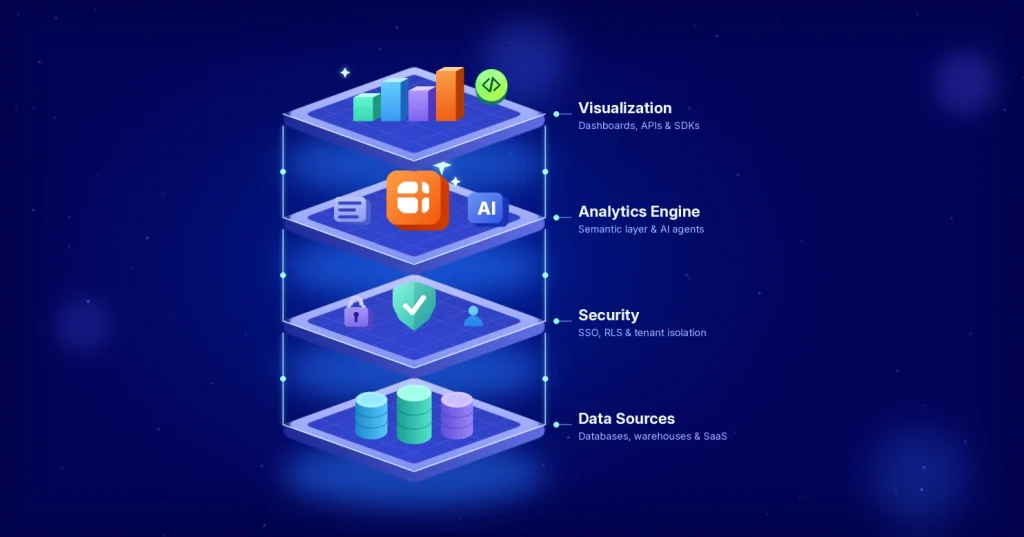
TL;DR: Embedded analytics initiatives often fail at the architecture level, not the dashboard level. Teams that settle tenant isolation, governed metrics, scalable data access, and AI-ready foundations early deliver embedded analytics that grows with their product.
Introduction
Most SaaS teams do not set out to build a fragile analytics stack. A dashboard gets added for one customer, another data source is integrated for a new requirement, and over time engineering teams find themselves managing slow queries, inconsistent metrics, and growing security concerns. The root cause is rarely the dashboard itself. More often, it is the absence of a well-designed embedded analytics architecture.
Users now expect analytics that can answer questions, explain trends, and surface anomalies. So architectural decisions around governance, security, and scalability matter as much as visualization design. This guide covers the key components, common patterns, SaaS tenancy models, deployment options, and best practices.
What is embedded analytics architecture?
Embedded analytics architecture is the framework that lets analytics operate directly inside another application, delivering dashboards and insights in the workflows users already use. Behind every embedded dashboard, it connects data sources, processes requests, enforces security, authenticates users, and integrates with the host application. Increasingly, it also supports AI assistants and agent-driven workflows.
How embedded analytics architecture works
Embedded analytics turns raw data into insights users can reach without leaving the application. Data flows from connected sources through preparation, security checks, and analytics processing, then reaches the host application through APIs and SDKs.
A simplified workflow might look like this:
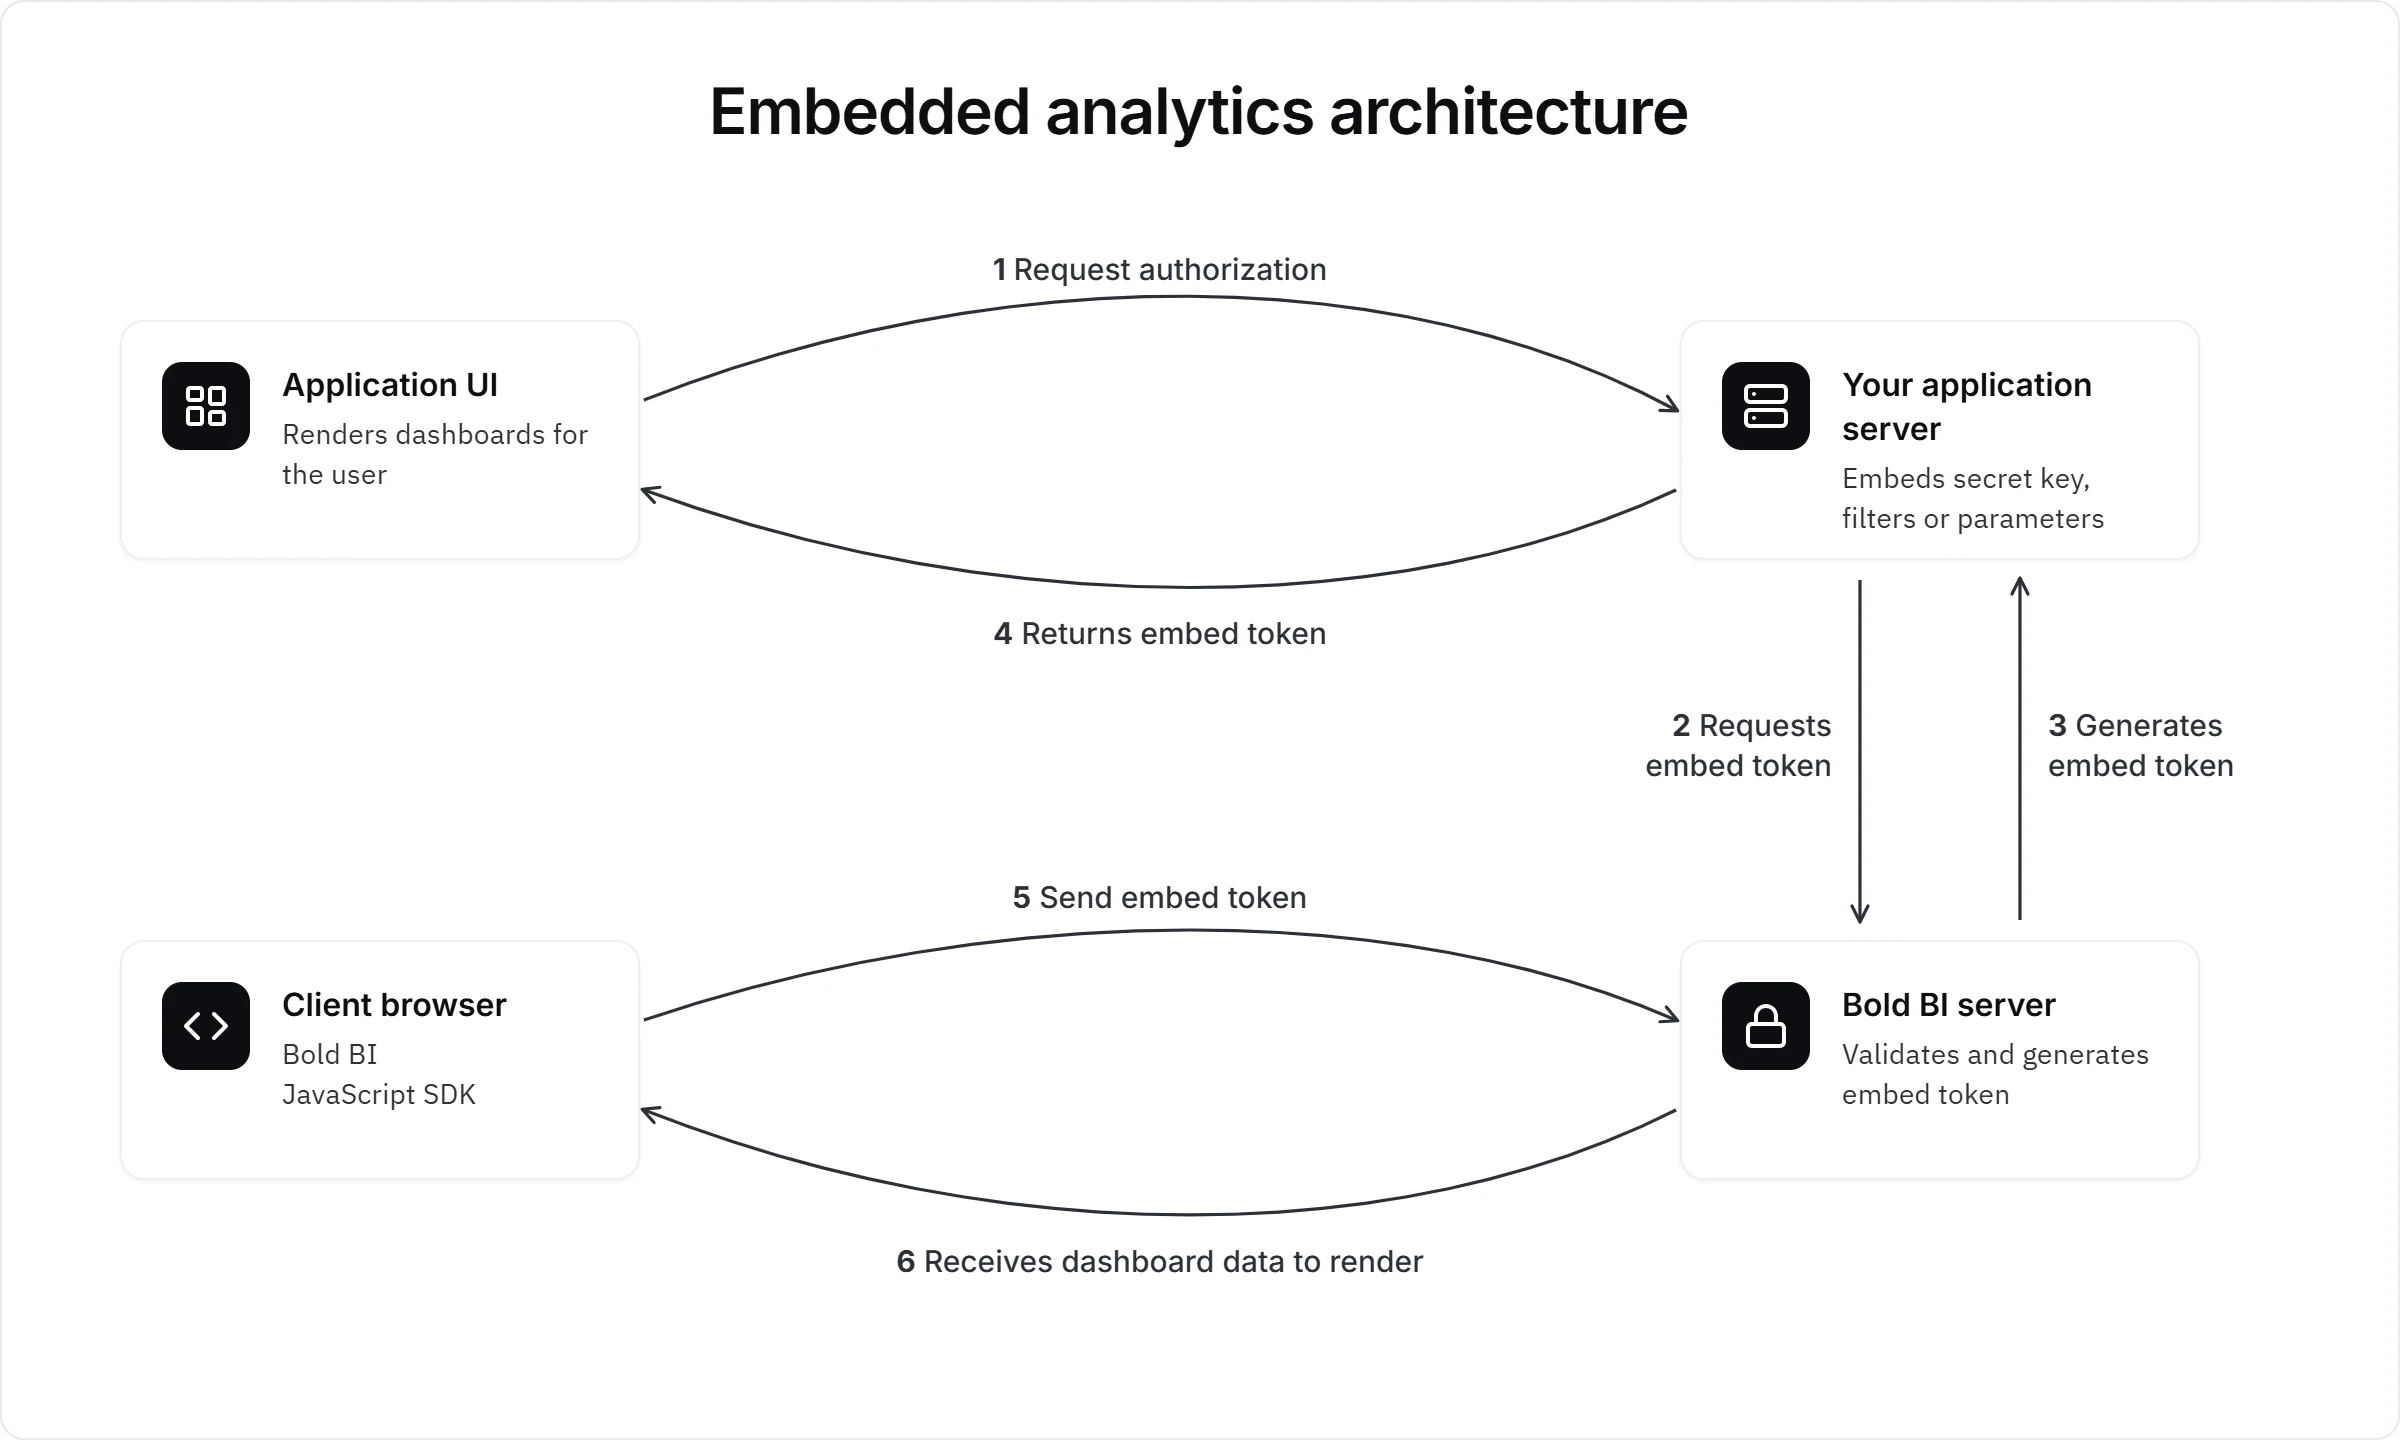
Although this workflow appears simple, each layer influences performance, governance, scalability, and security.
Core components of an embedded analytics architecture
A successful embedded analytics architecture relies on several interconnected components working together.
Data sources
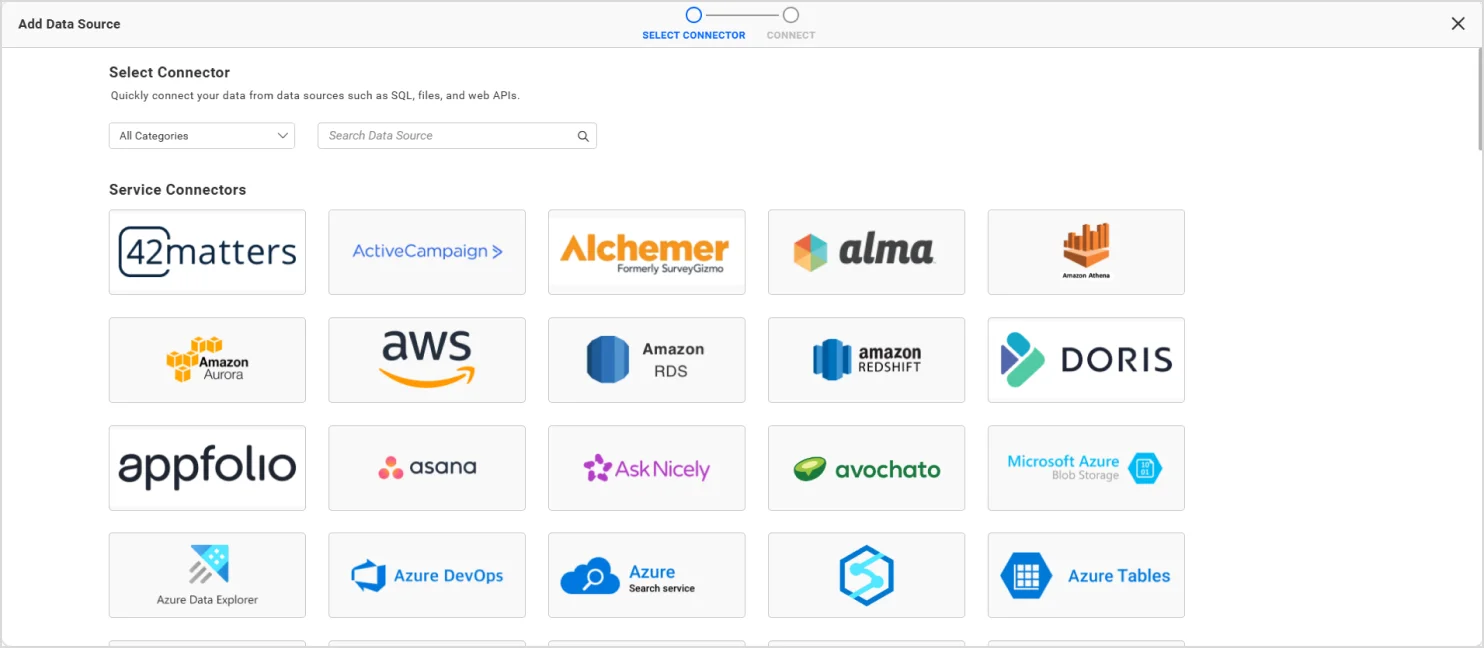
Every analytics experience starts with data from databases, SaaS applications, APIs, cloud services, or data warehouses. A SaaS company, for example, may combine Salesforce, Stripe, PostgreSQL, and Google Analytics data. The challenge is keeping the combined experience accurate, performant, and scalable as volumes grow, so treat connectivity as an architectural decision, not a configuration step.
Data integration layer
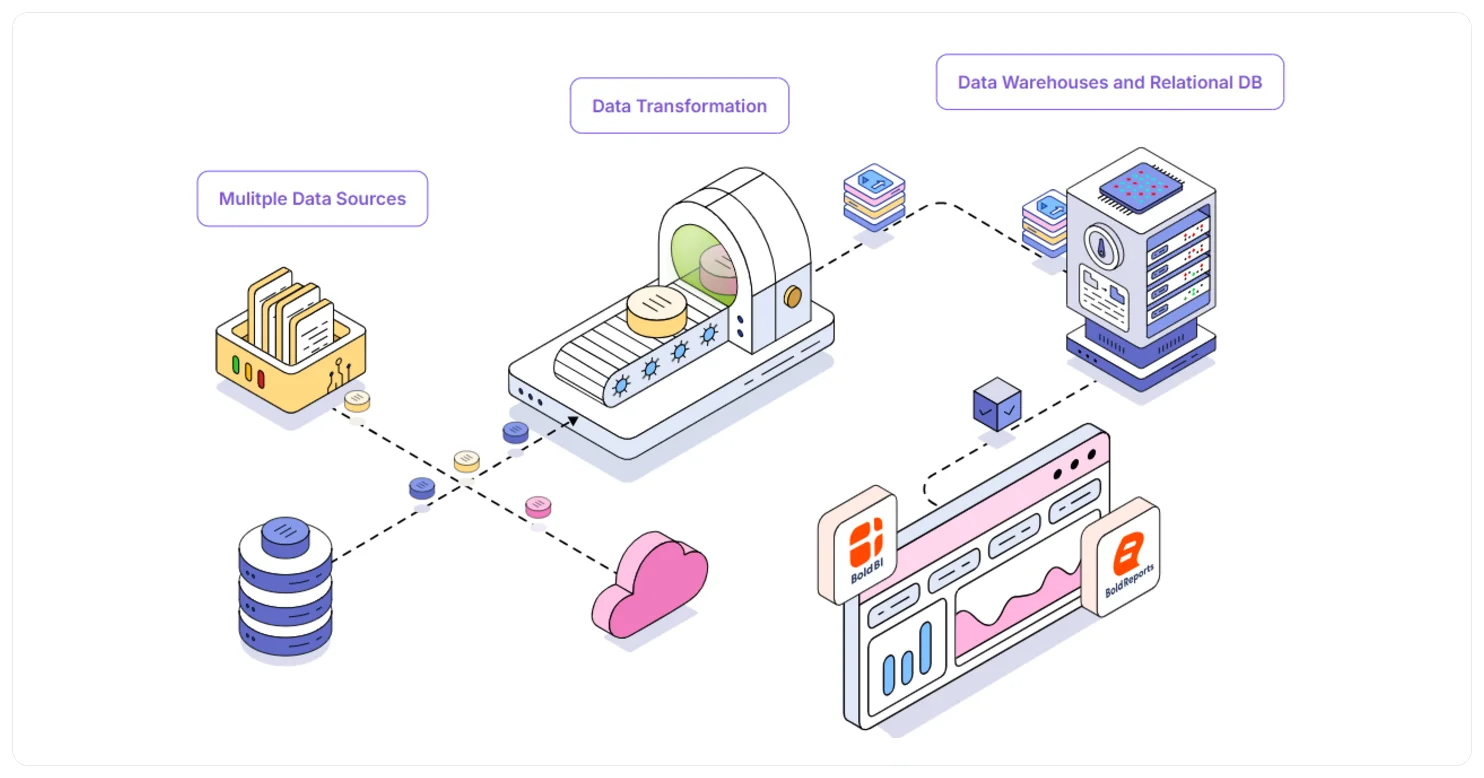
Before analysis, data often needs to be transformed, cleansed, aggregated, and refreshed on a schedule. This layer bridges operational systems and analytics and reduces the load on the systems behind them. Many organizations add caching, staging environments, or a central data warehouse, and as adoption grows this layer often becomes the most important place to optimize.
Semantic layer
MRR sounds simple until three dashboards disagree. One divides annual contracts by twelve, one excludes trials, and one counts discounts at list price.
A semantic layer defines each metric once, so every dashboard and AI answer uses the same number. In Bold BI®, you can define a shared calculation once as a Data Source Expression, available to every dashboard built on that data source. Dashboard Expressions stay inside a single dashboard.
Analytics engine
The analytics engine processes user requests, applies calculations, and retrieves the data behind each dashboard. When a user drills down or changes a filter, it decides which datasets to query, which security rules to enforce, and how to return the results. It directly shapes scalability and user experience.
AI and agent layer
AI-powered experiences can answer natural-language questions, explain metric changes, and surface anomalies. They also raise architectural questions: whether AI responses inherit row-level security, how tenant isolation is enforced, and which governed metrics the AI uses. The 7th best practice covers how to scope AI access to governed data.
Embedding methods: iframe vs. JavaScript SDK
How you embed analytics affects security, customization, and how native the experience feels. Most platforms offer two approaches.
| Method | How it works | Best for | Trade-off |
| iframe embedding | The dashboard loads inside an iframe on your page, using an embed URL | Quick proofs of concept, internal portals, and simple read-only views | Limited control over interactions, styling, and events between the dashboard and your app |
| JavaScript SDK | Your app renders the dashboard through an SDK, authenticated by a token generated on your backend | Customer-facing SaaS products that need tenant filters, custom interactions, and a native look | More development effort up front |
Many teams start with an iframe to validate demand, then move to the SDK once analytics becomes part of the product. Bold BI supports both, so you can start simple and switch methods without changing platforms.
APIs, SDKs, and developer-first analytics
APIs and SDKs connect the analytics platform to your application. They let you embed dashboards, pass user context, apply tenant-specific filters, and create an experience that feels native to your product.
For example, a typical Bold BI embedding implementation uses the JavaScript SDK and an embed token generated on your backend to securely render a dashboard within an application:
var boldbiEmbedInstance = BoldBI.create({
serverUrl: "<Bold BI Server URL>",
dashboardId: "<Dashboard Id>",
embedContainerId: "dashboard_container_id",
embedToken: "<Embed token generated from backend server>"
});
boldbiEmbedInstance.loadDashboard();
Modern embedded analytics platforms are also evolving toward developer-first architectures. APIs, SDKs, automation workflows, white-label capabilities, and MCP integrations enable development teams to integrate analytics into broader product experiences while maintaining flexibility and extensibility.
Visualization layer
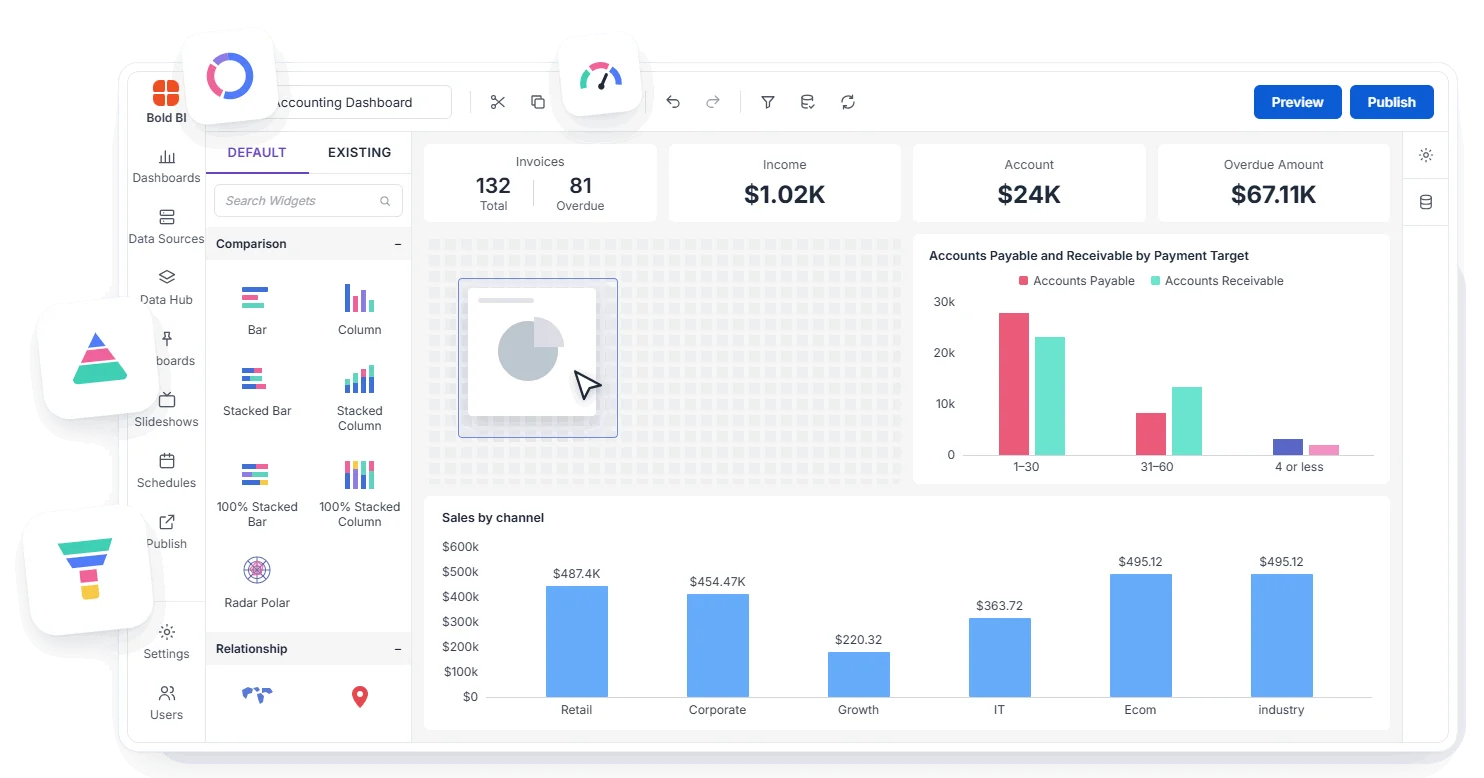
The visualization layer is what users see: interactive dashboards, KPI scorecards, charts, maps, data grids, and widgets embedded in application workflows. It should feel like a natural extension of the application. Before users interact with it, however, the system must confirm they are authorized to see the underlying data. That brings us to security.
Security layer
Security helps ensure users only access the data they are authorized to view. A strong embedded dashboard architecture typically combines authentication mechanisms such as SSO, OAuth, and JWT with authorization controls such as role-based access and row-level security. Together, these controls protect sensitive data without slowing users down.
OWASP’s 2025 Top 10 ranks broken access control first, and its list of common causes includes tampering with access tokens and modifying URL parameters.
In embedded analytics, that risk shows up as one customer seeing another’s data. See the 4th best practice for how to test for it before every release.
Embedded analytics architecture for SaaS applications
Building embedded analytics for one organization is relatively straightforward. Serving many customers through a SaaS application means the architecture must support scalability, security, and tenant isolation without compromising performance.
| Model | How it works | Benefits | Considerations |
| Shared database | All tenants use one database, and security rules control which records each customer can access | Lower infrastructure cost, simpler maintenance, faster onboarding | Strong row-level security is essential; configuration errors can expose data across tenants |
| Dedicated database | Each tenant has a separate database | Stronger isolation, easier compliance management, flexibility for customer-specific needs | Higher infrastructure cost and more operational complexity as the customer base grows |
Bold BI supports single-site and multi-site layouts. In a multi-site deployment, each tenant gets its own site, with its own database for dashboards and resources, inside one installation. When only the data differs between tenants and the schemas match, custom attributes can switch a dashboard’s data source connection per tenant, so one template serves every customer.
Common embedded analytics architecture patterns
The following comparison can help identify which architecture pattern best aligns with your business and technical requirements:
| Pattern | Best for | Primary advantage | Main trade-off |
| Direct query | Real-time operational analytics | Always uses the latest data | Can increase load on source systems |
| Cached analytics | High-performance dashboards | Faster response times | Data freshness depends on refresh intervals |
| Data warehouse-centric | Large-scale analytics environments | Consistent metrics and improved scalability | Additional infrastructure and administration |
Deployment options
- Cloud: Fully managed, with simplified administration and rapid scalability. Best for speed and operational efficiency.
- Managed Private Cloud: A dedicated cloud environment, operated for you, with more control over security, governance, and compliance.
- On-Premises: Complete control over infrastructure, data, and security policies, including air-gapped and offline operation. Best for strict governance or data residency requirements.
For a detailed comparison, see our BI deployment model guide.
Build vs. buy: choosing an embedded analytics strategy
One of the most common decisions organizations face is whether to build embedded analytics capabilities internally or adopt an existing analytics platform.
| Approach | Advantages | Challenges |
| Build internally | Maximum customization and full architectural control | Longer development timelines, higher engineering investment, ongoing maintenance, and longer time-to-market |
| Adopt an embedded analytics platform | Faster deployment, included security controls, built-in scalability, and lower maintenance | Vendor dependency, licensing considerations, upgrade schedules outside your control, and potential customization constraints |
For many organizations, the decision comes down to resource allocation. Building means developing and maintaining dashboards, security controls, multi-tenancy, APIs, and supporting infrastructure. A platform lets your team spend that effort on core product innovation. For a deeper look, read Choosing Embedded BI: Build or Buy? and Build vs Buy Analytics: Which Is Better for Your Business?
Embedded analytics architecture best practices
Many embedded analytics problems come from decisions made, or skipped, early on. Use these best practices as a checklist before your first customer-facing release.
1. Design for multi-tenancy from day one
Retrofitting tenant isolation after launch means reworking data models, security rules, and deployment scripts while customers are live. Pick your tenancy model before you build the first dashboard: a shared database with row-level security, or a dedicated database per tenant. In Bold BI, you can give each tenant its own site (multi-site), or keep tenants in one site and use custom attributes to switch each tenant’s data source. Choose based on how much isolation each customer needs.
2. Define metrics once in a semantic layer
If MRR, churn, or active users are calculated inside individual dashboards, the numbers can drift apart, and customers may notice before you do. Define each business metric once, at the data source level, and reuse it everywhere. In Bold BI, a Data Source Expression makes a calculation available to every dashboard built on that data source. AI answers are also more consistent when the assistant works from governed definitions.
3. Generate embed tokens on the server
Never build authorization logic in the browser, where users can inspect and tamper with it. Generate embed tokens on your backend and pass user context, such as custom attributes and row-level filters, through the token. In Bold BI, filters applied through the embed token are applied on the server and aren’t exposed to end users.
4. Test with two tenants before every release
Broken access control is the top risk in OWASP’s 2025 Top 10, so treat tenant isolation testing as non-negotiable. Before each release, sign in as users from two different tenants and try to reach each other’s dashboards, filters, exports, and AI answers. Make this a required release gate, not an occasional audit.
5. Match your data access pattern to freshness needs
Not every dashboard needs live data. Use direct queries for operational views where the latest numbers matter. Use cached data for high-traffic dashboards where speed matters more than second-by-second freshness. Mixing both patterns deliberately protects your source systems without slowing down users.
6. Monitor query load as adoption grows
A dashboard that runs well for ten customers can overload a production database at a thousand. Track query volume, response times, and the most expensive queries per tenant from the start. Rising load is often the signal to add caching, move heavy workloads to a data warehouse, or split high-volume tenants onto dedicated resources.
7. Scope AI access to governed data
AI assistants should inherit the same security rules as dashboards, not work around them. Confirm that AI responses respect SSO and row-level security. Design data sources around clear business domains, so the AI works from focused, well-defined data. Bold BI states that SSO and row-level security carry into embedded sessions of its AI Assistant, which queries one data source or one dashboard at a time. Well-scoped data sources help keep its answers focused.
Embedded analytics architecture example: a SaaS scheduling platform
Consider a hypothetical SaaS company that sells appointment-scheduling software to clinics. Clinic managers regularly email support asking for no-show reports, and each request takes the support team time to pull manually.
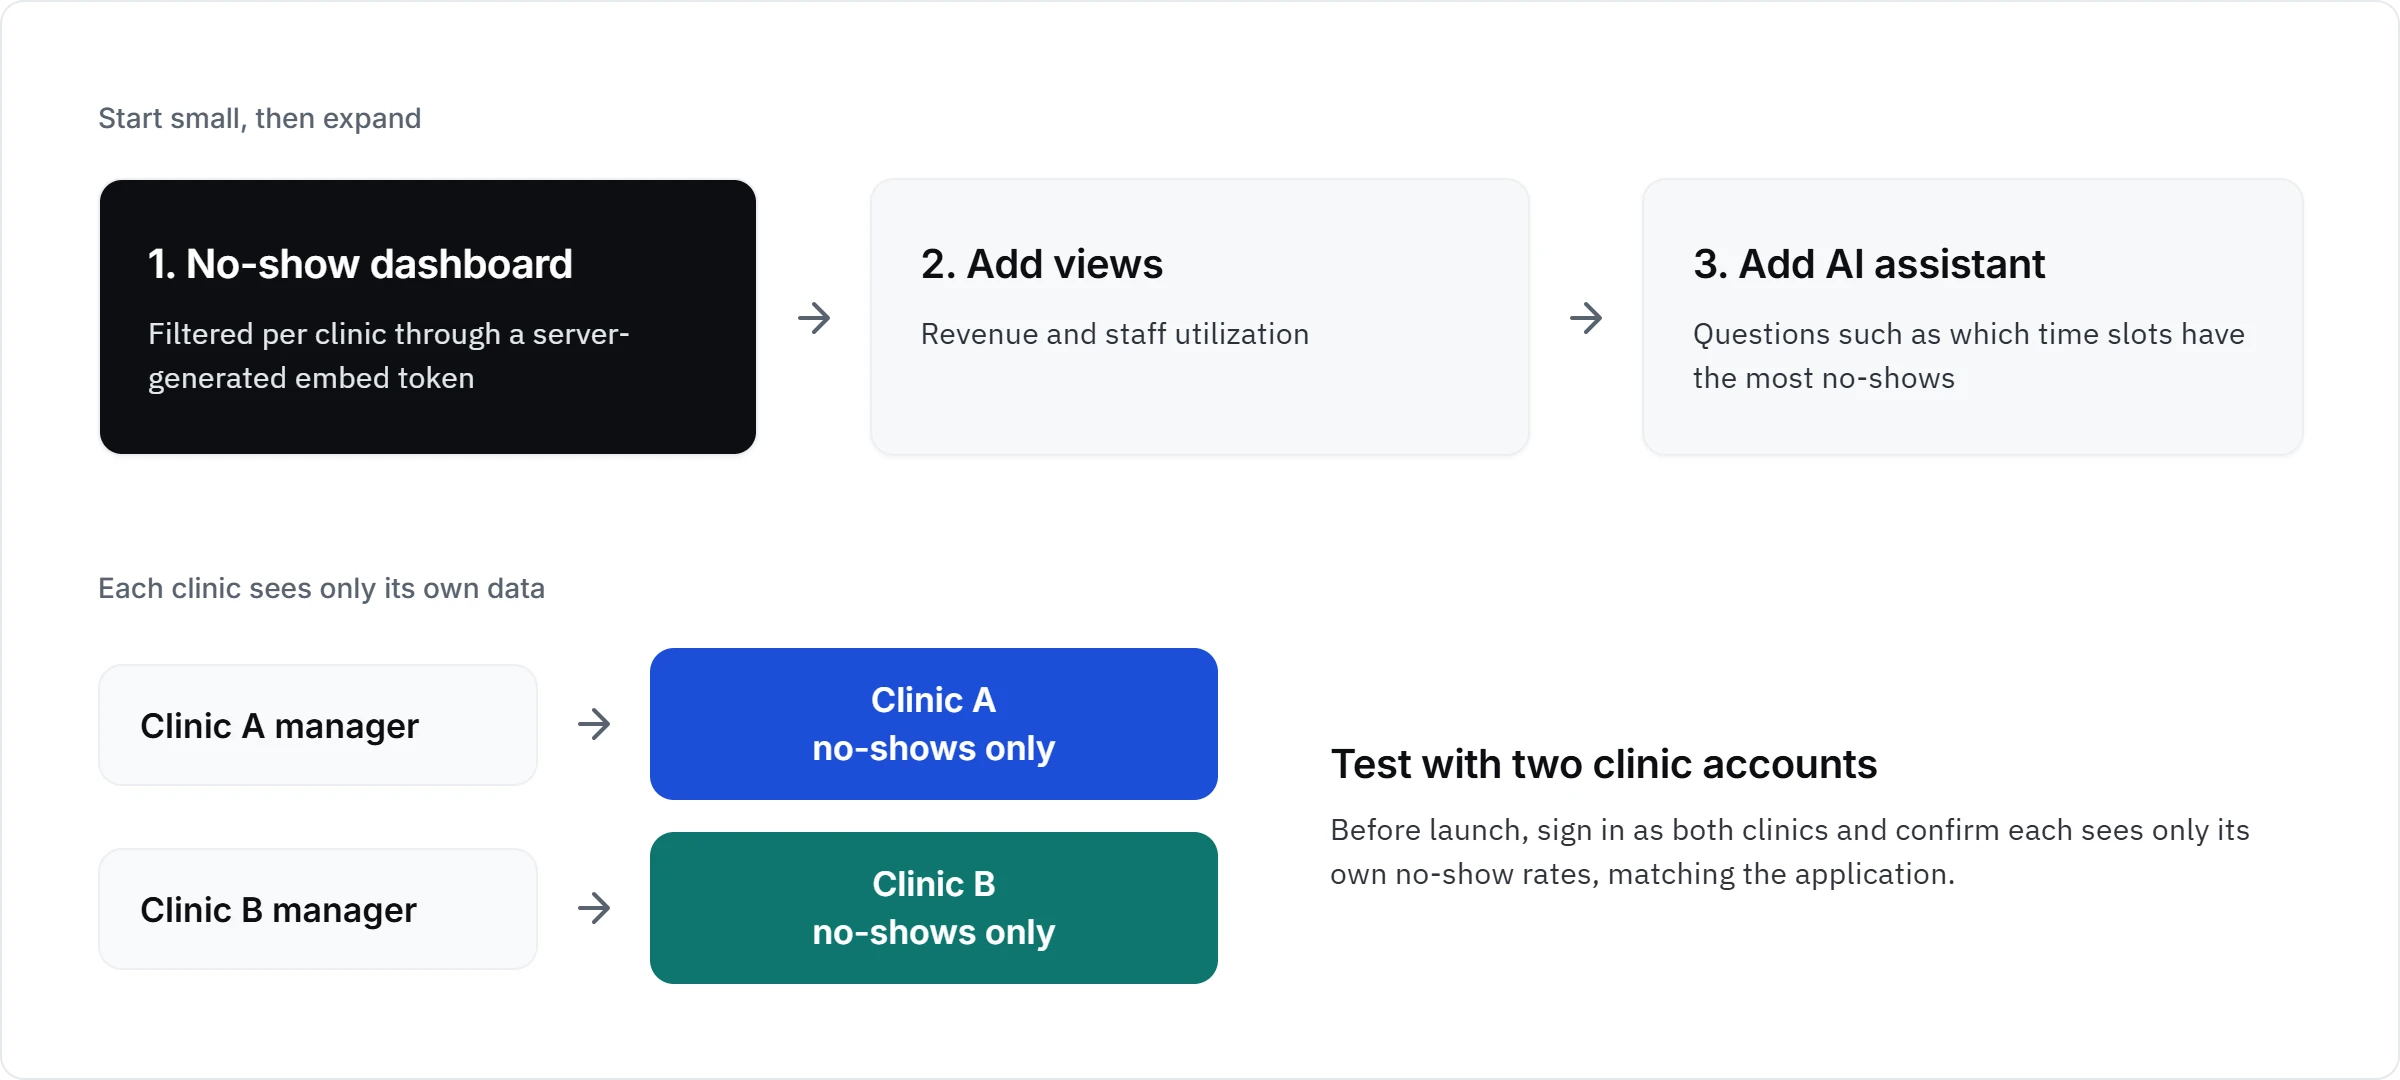
Rather than launching a full analytics suite, the team starts small. They embed one no-show dashboard for clinic managers and filter it per clinic through a server-generated embed token. Before launch, they test with two clinic accounts and confirm that no-show rates match the figures in the application. Once managers are using the dashboard, the team adds revenue and staff-utilization views. Later, they add an AI assistant so managers can ask questions such as “Which time slots have the most no-shows?”
What changes: managers can spot no-show trends and act on them, for example by sending reminders for high-risk time slots, without waiting on support. The support team should spend less time on manual report requests.
How Bold BI supports embedded analytics architecture
Building a modern embedded analytics architecture takes more than embedding dashboards.
Bold BI® helps by enabling you to:
- Embed dashboards with the JavaScript SDK in React, Angular, Vue, ASP.NET Core, and Blazor apps.
- Run the same features in Cloud, Managed Private Cloud, and On-Premises editions, including air-gapped operation on premises.
- Apply row-level filters on your server through the embed token, so users never see the filter logic.
- Isolate tenants with single-site or multi-site layouts, and switch a dashboard’s data source per tenant with custom attributes.
- Avoid per-user fees: Bold BI’s pricing page states there is no per-user fee, and quotes depend on factors such as deployment type and user count.
Ready to put this embedded analytics architecture into practice? Start a free trial or book a personalized demo to see how Bold BI handles security, multi-tenancy, and deployment in your environment.
Frequently asked questions
-
- 1.
What are the core components of embedded analytics architecture?
The primary components include data sources, data integration, semantic layer, analytics engine, APIs and SDKs, visualization layer, AI capabilities, and security controls.
- 2.
Why is embedded analytics important for SaaS applications?
Embedded analytics helps SaaS providers deliver insights directly inside user workflows, increasing product value and improving user adoption.
- 3.
How does AI enhance embedded analytics?
AI can answer questions, identify patterns, explain changes, recommend actions, and support agentic workflows through natural-language interactions.
- 4.
Should I build or buy an embedded analytics solution?
Building provides greater control but requires substantial engineering effort. Purchasing an embedded analytics platform typically accelerates deployment while reducing maintenance and infrastructure complexity.
- 1.





