

Online Retail Inventory Optimization with Visualization
One key to success in online retail is efficient inventory management. It is essential to optimize inventory as e-commerce expands and consumer expectations change. Online merchants can get unmatched insights into their inventory operations, make educated decisions in real time, and strike the delicate balance between satisfying client requests and lowering operating costs by utilizing the power of data visualization. In this blog, we examine the role that visualization plays in the optimization of online retail inventories.
Why inventory optimization is important for online retailers
Inventory optimization is important for online retailers because it can help them to:
- Increase sales: By maintaining an appropriate stock of products, e-commerce businesses can avoid stockouts and backorders, which often lead to missed sales opportunities.
- Improve customer satisfaction: If customers can get what they want quickly and accurately, they are more likely to be pleased with their purchasing experience.
- Reduce costs: Through inventory optimization, e-commerce businesses can reduce expenses linked to inventory maintenance, such as storage and insurance.
- Improve operational efficiency: Inventory optimization can help online retailers enhance their operational effectiveness by saving time and resources spent on inventory management tasks.
- Increase profitability: Inventory optimization can make online retailers more profitable as they find the sweet spot of holding just enough inventory to satisfy sales.
Visualizing your data gives you the insight to improve these processes.
How to use data visualization to improve inventory optimization
The following are some examples of how data visualization can improve inventory optimization:
- Improved Decision-Making: Visualizations provide a clear illustration of inventory data, enabling decision-makers to grasp its current status and trends quickly.
- Real-time Inventory Visibility: Dashboards give retailers a quick view of current inventory levels, including available stock, goods that are on order, and backorders. This information helps them anticipate stock levels accurately and quickly fill client orders.
- Inventory Turnover Analysis: Retailers can spot slow-moving items by visualizing inventory turnover rates. They are now able to modify their procurement tactics and concentrate on pushing more profitable products.
- Demand Forecasting: Dashboards can be used by retailers to optimize inventory levels, avoid overstocking or understocking, and enhance order accuracy by integrating previous sales data and forecasting future demand using predictive analytics.
- Supplier Performance Tracking: Retailers can track delivery timeframes, order accuracy, and product quality with dashboards to keep an eye on supplier performance. This information allows better supplier management and helps maintain a healthy inventory flow.
- Seasonal Trends Analysis: Retailers can identify seasonal purchase trends with the aid of dashboards. Planning marketing campaigns, modifying inventory levels, and optimizing product assortments all depend on understanding this data.
Metrics for inventory management
Let’s look at some widgets visualizing the metrics for inventory management.
Days inventory outstanding
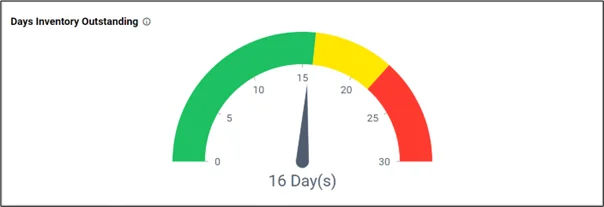
This metric computes the average number of days a business takes to sell its inventory. It assists in assessing the efficiency of inventory turnover and working capital control by helping managers minimize holding costs and determine potential sales bottlenecks.
Average lead time
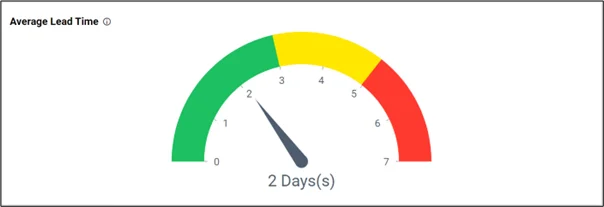
This metric measures the actual time it takes for products to be restocked from suppliers, enabling businesses to plan and adjust inventory levels more effectively and minimize the risk of stockouts.
Stock summary
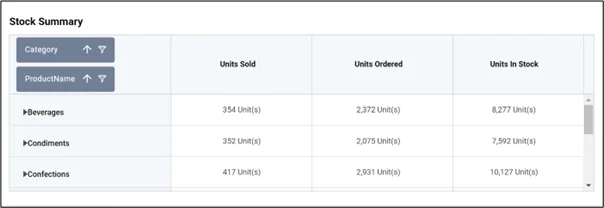
This metric provides an overview of inventory details, including the total stock on hand, the value of inventory, and the number of items by category, allowing businesses make informed decisions regarding stock levels and allocation.
Sell through rate
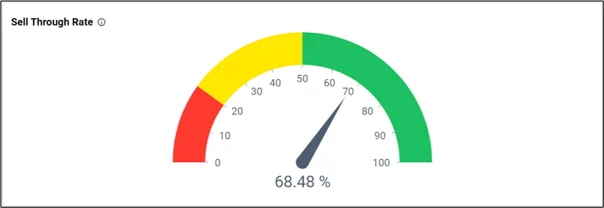
This metric measures the percentage of inventory sold over a certain time period, enabling retailers assess product performance and make informed restocking decisions, essentially promoting inventory turnover and profitability.
Order fill rate
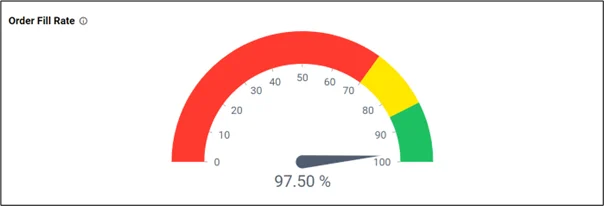
This KPI showcases the percentage of customer orders that are fulfilled completely and on time, reflecting the efficiency of the company’s inventory management and customer satisfaction.
Returned products by category
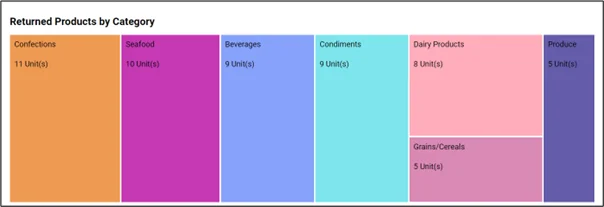
This metric tracks the frequency and type of products returned by customers, enabling retailers identify trends, quality issues, and areas for improvement in specific product categories.
Purchase order details
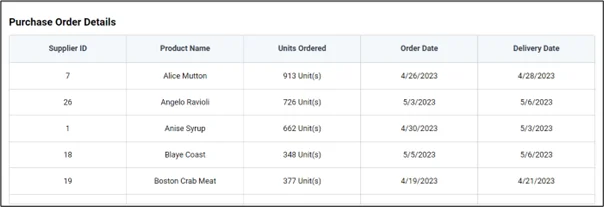
This metric provides basic information about supplier orders, including order status, expected delivery dates, and quantities ordered, enabling retailers to track and manage their incoming inventory effectively.
Units ordered forecast
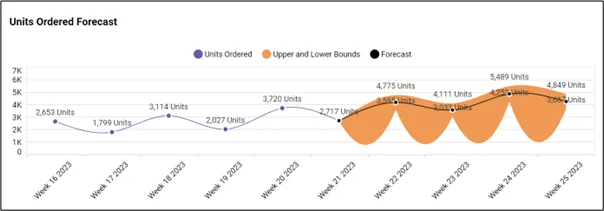
This widget makes proactive inventory planning and stock optimization possible based on predictive analytics. Weighing the past several weeks of order data, the most likely ordering scenario for the next few weeks is predicted. Company leaders can enter variables and see how the predictions change.
Average inventory value by category
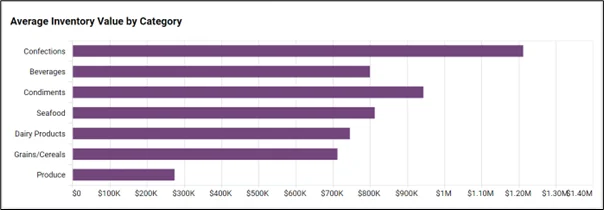
This metric calculates the value of the inventory within each category of products. It aids in assessing the profitability of various product categories and improving storage and procurement plans accordingly.
Gross margin ROI
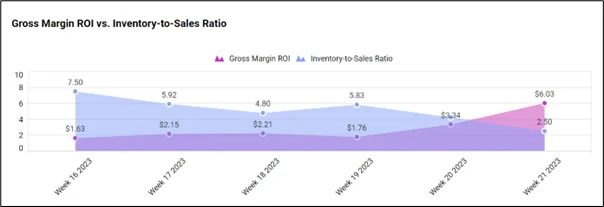
This KPI helps assess the profitability of inventory investments by computing the return on gross margin relative to the cost of the inventory, enabling businesses to optimize their inventory levels for maximum profitability.
Inventory and stockout rate by category
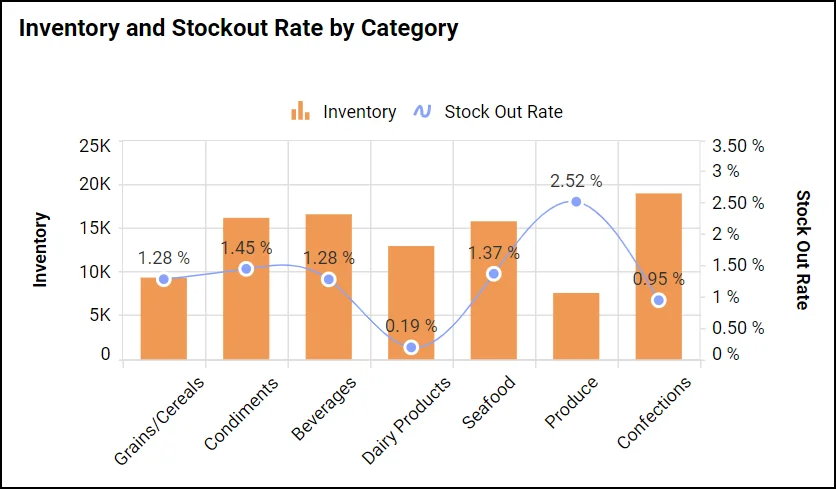
This metric monitors stock levels and the frequency of shortages within particular product categories to assist retailers in optimizing stock allocation, reducing shortages, and enhancing overall inventory management effectiveness.
Inventory turnover ratio
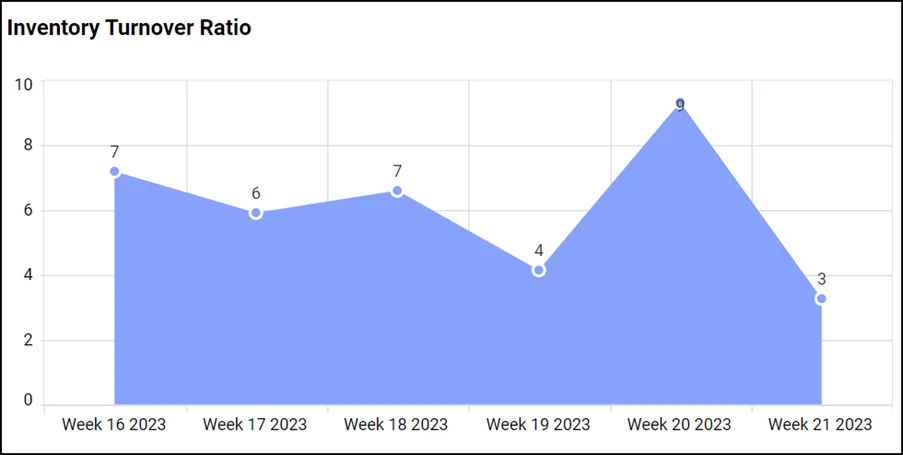
This metric tracks the efficacy of inventory management and stock levels in relation to sales by determining how well a merchant is selling and restocking its inventory. It aids companies in maximizing cash flow and stock levels.
Factors to consider when selecting a visualization tool for inventory management
Consider the following factors when making your choice of visualization tool for inventory optimization:
- Data sources and formats: The tool should be able to handle various data types and link to your inventory data sources, such as databases and spreadsheets.
- Data features and functions: To assist you in visualizing your data, the tool should include a variety of data features and functionalities, such as filtering, sorting, and grouping.
- Visualization features and functions: To enable you to design unique representations that match your unique requirements, the tool should offer a variety of visualization capabilities and customization options.
- User interface and experience: To make it simple to build and change visualizations, the tool’s interface should be user-friendly.
- Collaboration and sharing features: You should be able to collaborate on creating the visualizations and distribute them using the tool.
- Pricing: The tool should fit within your budget.
Tracking KPIs in a retail inventory management dashboard like the following one enables retailers to gain quick insight into their inventory performance.
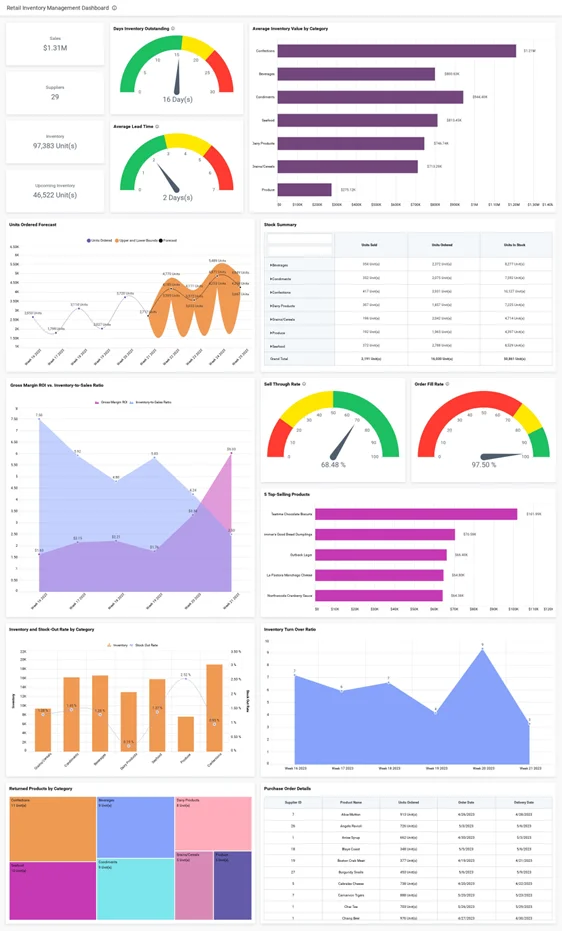
The previous dashboard was created using Bold BI® by Syncfusion. It helps retailers quickly understand their inventory status, sales performance, and consumer behavior patterns. Real-time data interpretation enables prompt, well-informed decision-making, boosting operational effectiveness, cutting waste, and eventually raising profitability.
Get started with Bold BI by signing up for a free trial and create more interactive business intelligence dashboards. You can also contact us by submitting your questions through the Bold BI website or, if you already have an account, you can log in to submit your support question.





