

Retail Inventory Management Dashboard
Understand inventory levels and product movement to reduce stock issues and improve availability.
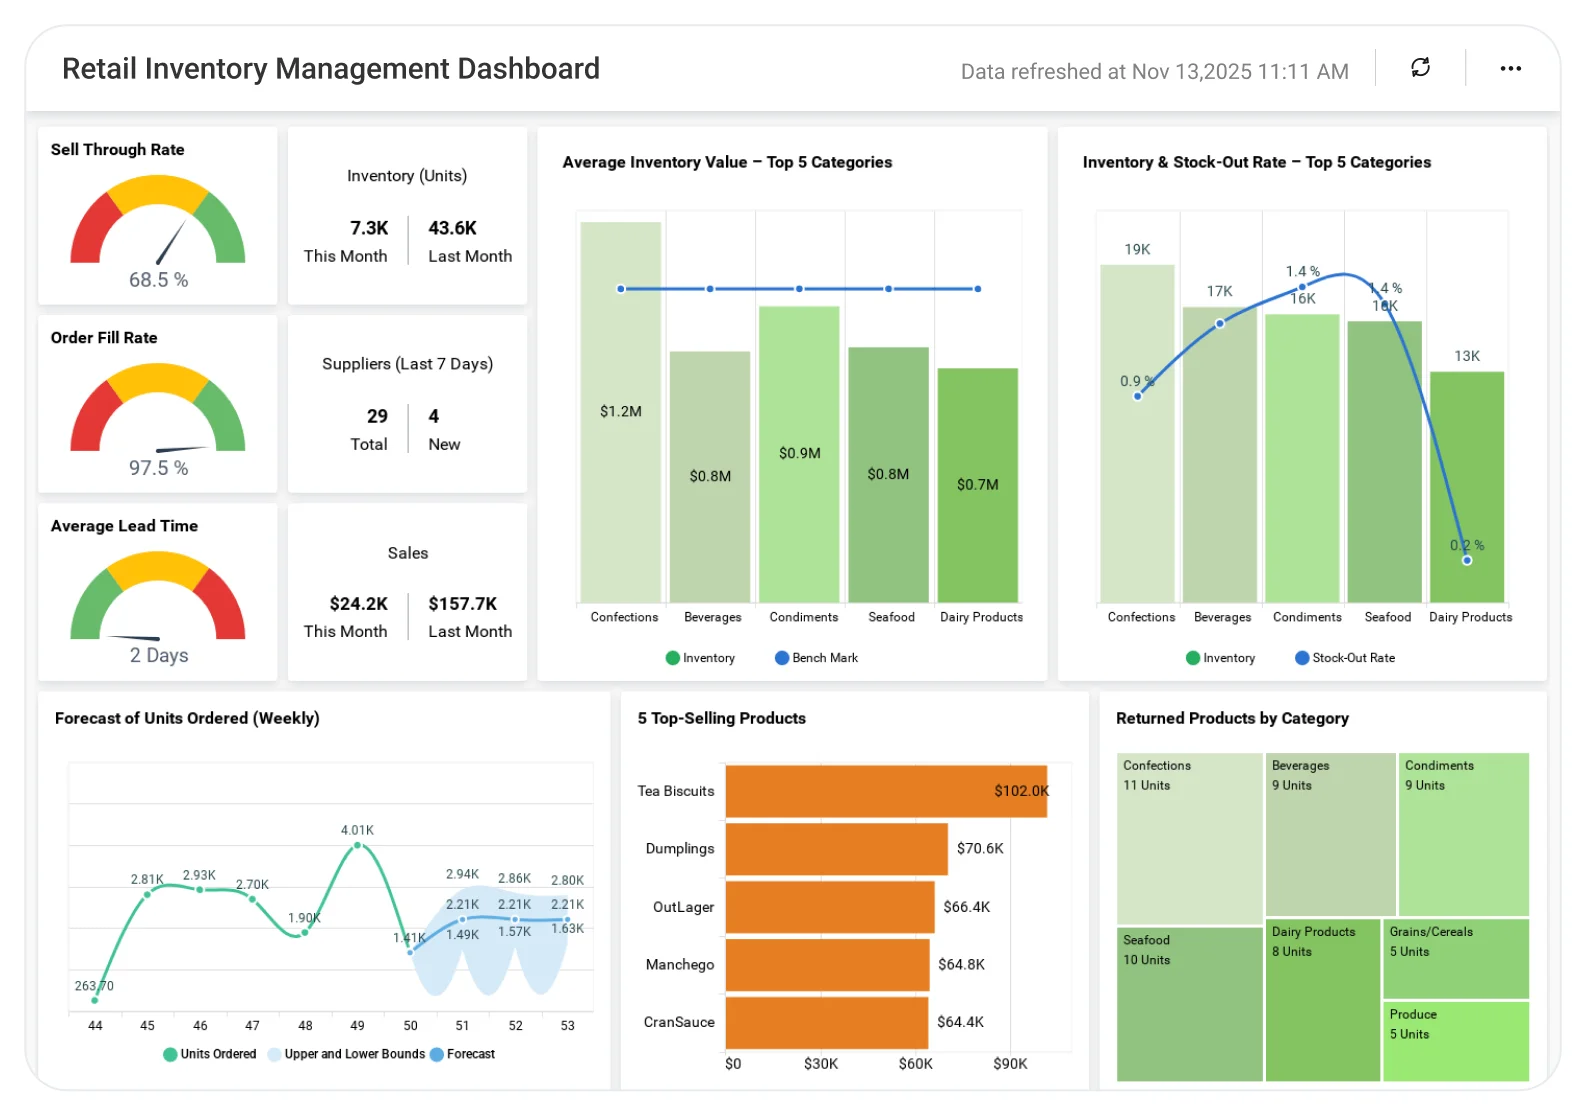
The Retail Inventory Management Dashboard helps teams analyze stock levels, turnover rates, and demand patterns, enabling better replenishment planning, reduced overstock or stockouts, and more efficient inventory management.
TL;DR
-
Inventory Transparency: See what’s in stock, what’s sold, and what’s inbound, organized by category or SKU.
-
Profitability Visibility: Get the GMROI and turnover ratios for all product categories.
-
Return Study: Analyze return reasons such as damaged, defective, or incorrect items and reduce avoidable losses.
-
Order Tracking: Expected arrival dates and detailed PO breakdowns for your top-selling SKUs.
-
Drill-down Visibility: Click on any category or item for detailed KPIs, order metrics, and return trends.
What Is a Retail Inventory Management Dashboard? (Quick answer)
A retail inventory management dashboard displays stock availability, purchasing activity, returns, and profitability in one real-time view, helping teams prevent both stockouts and overstocking.
In Bold BI, this translates into interactive visuals that help you keep shelves stocked, reduce lost sales, optimize replenishment, and ensure the right products reach the right stores at the right time.
Why Retail Inventory Management Matters
Retail performance depends on having clear visibility into sales, inventory, and margins across stores and products. When data is spread across POS systems, spreadsheets, and reports, teams struggle to react quickly to stock issues, pricing problems, or changing customer behavior.
Retail analytics helps teams optimize inventory, improve profitability, reduce stockouts and overstocking, and make faster decisions that directly impact revenue and customer experience.
What You’ll Track
-
Stock Availability: Total stock on hand, units sold, incoming stock, and category-to-SKU visibility for quick, aggregated insights.
-
Order Tracking & Replenishment: Expected delivery dates, purchase order details, and real-time views of incoming orders vs. current stock levels.
-
Returns & Damages: Returned items by reason, category-level return trends, and heatmap indicators to spot quality issues and reduce churn.
-
Profitability Metrics: GMROI, inventory turnover ratio, and category-level profitability for apparel, footwear, accessories, and more.
All the dashboards are fully customizable, allowing you to add KPIs such as stockout rate, shrinkage, aging inventory, and reorder alerts to create a complete inventory turnover dashboard.
How It Works
From data connection to live dashboards in hours, not weeks.
-
Connect POS, ERP, warehouse, or spreadsheet data.
-
Apply the Retail Inventory Management sample with pre-built metrics.
-
Blend purchasing, sales, and warehouse data for a complete view.
-
Share dashboards with store managers, buyers, and execs.
-
Set alerts for low stock, high returns, delayed orders, or low turnover.
Why Bold BI Is the Right Fit for Retail Inventory Analytics
-
Works with your retail data: Connect POS systems, ERPs, databases, and spreadsheets in one dashboard.
-
Unified retail KPIs: Track inventory, sales, returns, and financial metrics together.
-
Deep product-level drilldowns: Drill from department-level views down to SKU-level insights.
-
Self-service analytics: Enable store managers, ops teams, buyers, and executives to analyze data without manual reports.
-
Secure & embeddable: Embed dashboards into POS or internal portals with Row Level Security, Single Sign On, and Role Based Access Control.
-
Flexible deployment: Deploy securely in the cloud or on-premises environments.
Compare Options (at a glance)
| Feature | Bold BI | ERP/POS Standard Reports | Spreadsheets |
|---|---|---|---|
| Stock on hand & inventory valuation (by store/DC/SKU) | Yes | Limited | Manual |
| Demand trends & sell-through analysis (category/season/channel) | Yes | Partial | Manual |
| Stockout, overstock & reorder alerts (threshold-based monitoring) | Yes | Limited | Manual |
| Replenishment performance (lead time, fill rate, supplier SLAs) | Yes | Partial | Manual |
| Markdown, shrink & margin impact analytics | Yes | Limited | Manual |
| Assortment & store performance (GMROI, turns, weeks of supply) | Yes | Limited | Manual |
| Custom KPIs, role-based views & embedded dashboards | Fully customizable | Fixed | Manual |
Frequently Asked Questions
More Articles About Retail Inventory Management
-
Online Retail Inventory Optimization with Visualization
 Explains how data visualization improves inventory optimization for online retailers, with tips on demand forecasting and turnover analysis.
-
Benefits of Embedded Analytics in Retail Industry
Discusses how embedded analytics improves inventory management, customer retention, and operational efficiency in retail.


