

Why You Should Choose Bold BI for Dashboarding

A dashboard provides a unified view of data. Together with analytics applied for raw data analysis, dashboards empower you to make better decisions quickly in your business. Bold BI® is a powerful BI application for analyzing and visualizing your data, giving you greater insights into your business. Bold BI allows you to connect with a wide variety of data sources including cloud databases, REST-based web data sources, and enterprises data sources and files. It comprises 35+ widgets for better visualization and analysis. Bold BI has a pack of useful features that can satisfy anyone who chooses it for their analytics and dashboarding. Let’s look at some of the feature highlights of Bold BI that make it the clear choice for dashboarding.
150+ data source connectors
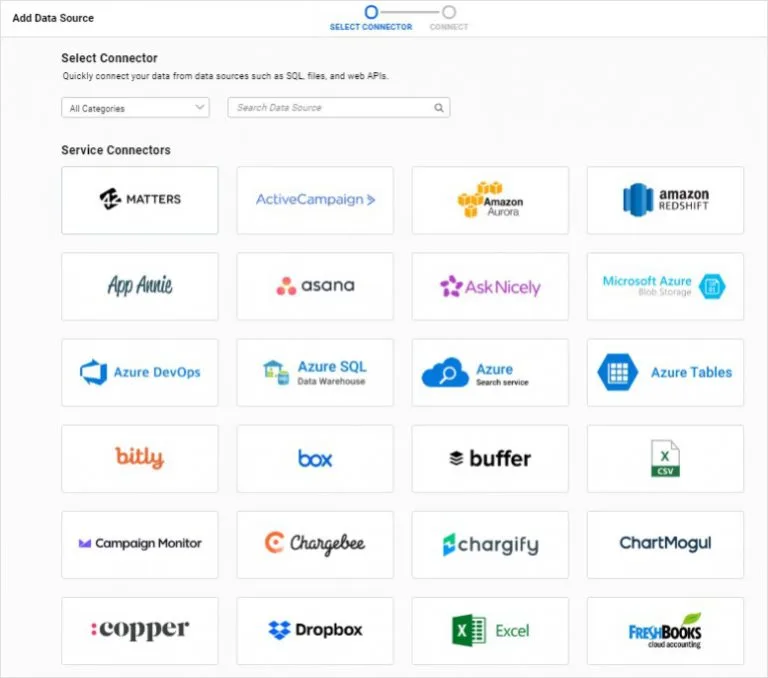
Bold BI supports 150+ data source connectors, including data connection support for files, NoSQL databases, SQL databases, cloud applications with REST API, and cloud file-sharing services. Bold BI offers support for some of the major web service connectors from providers like Amazon, Azure, Google, FreshBooks, and Salesforce.
Future data predictions
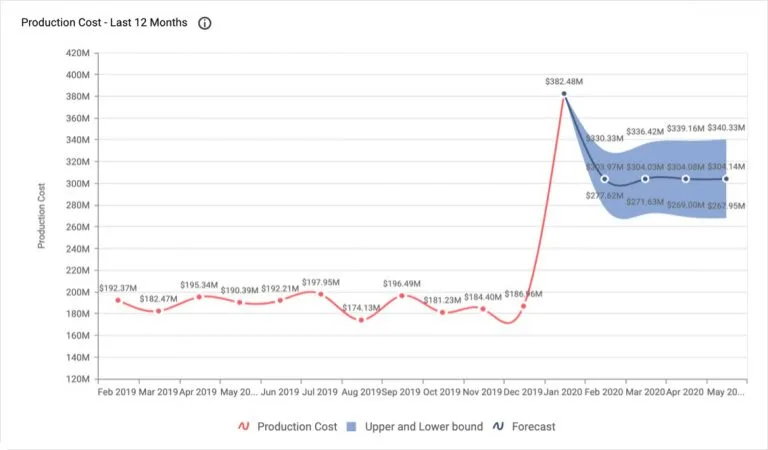
Predictions are simplified for time series data by using forecasting support in Bold BI charts. Here, Bold BI uses the exponential smoothing technique to predict the future data.
Quick dashboards
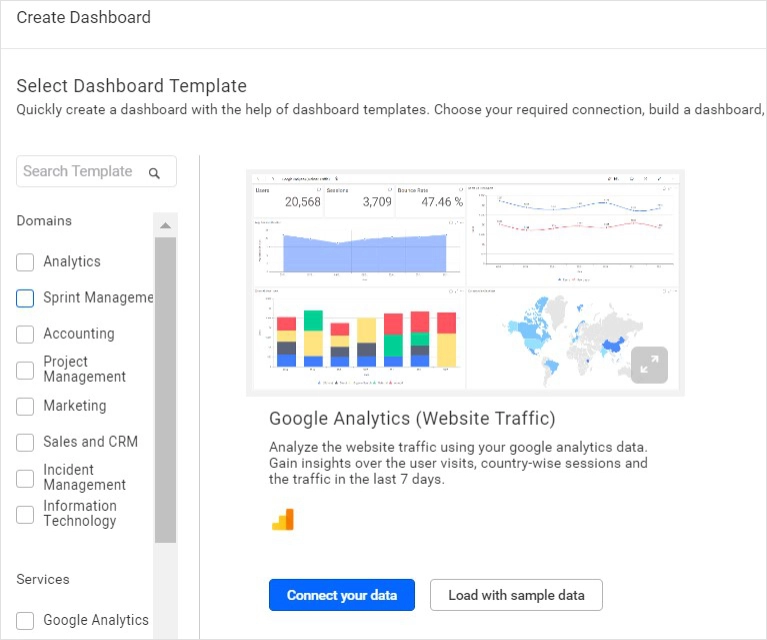
Quick dashboard creation is now possible using dashboard templates in Bold BI. Simply connect your data and create dashboards with the help of 12 different built-in templates.
35+ visualization widgets
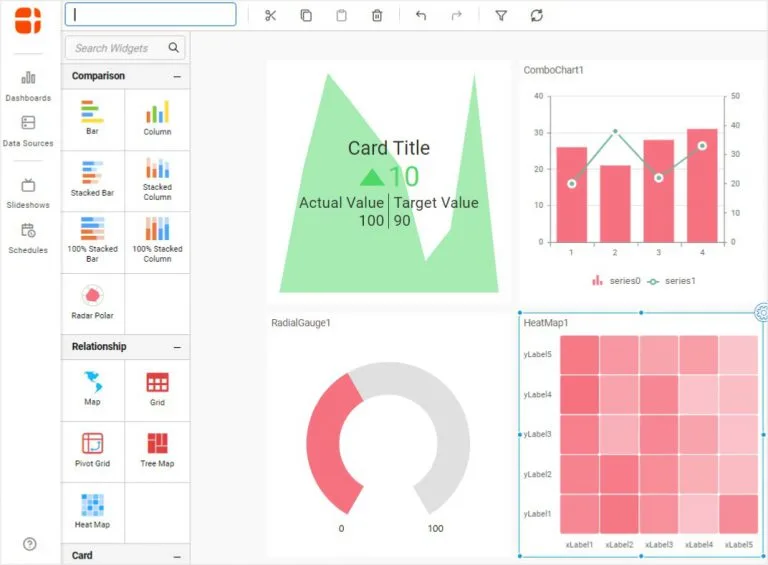
Bold BI focuses on effective data visualization for better decision-making with its 35+ widgets. They are tailor-made to understand your data better and give you greater insights. The available widgets include powerful visuals like a pivot grid, KPI card, combo chart, and heat map.
Interactive query mode
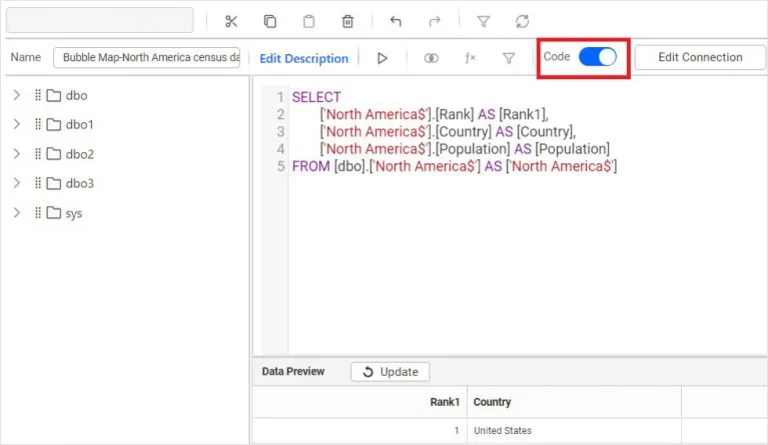
Bold BI offers an interactive query window where you can either write SQL queries from your data designs or import custom queries for data preparation.
Data modeling
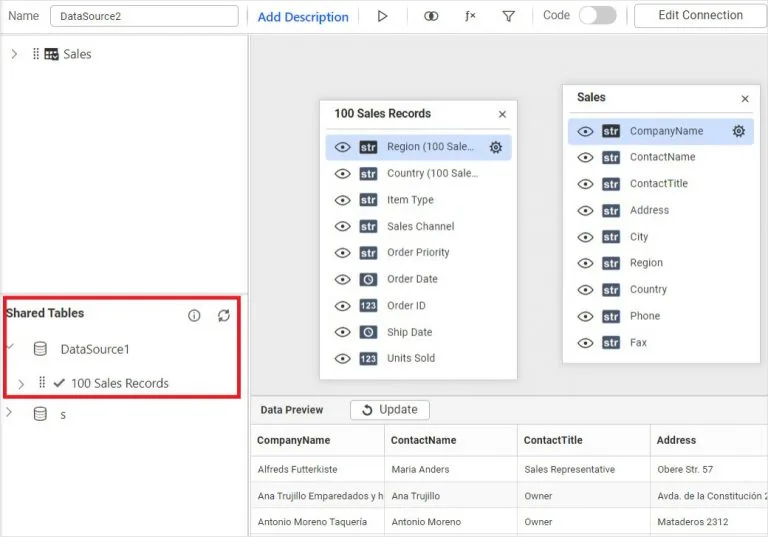
You can connect data from multiple data sources using the shared tables feature in our Bold BI dashboards. Relationships can be defined while connecting the data sources.
Hassle-free refresh
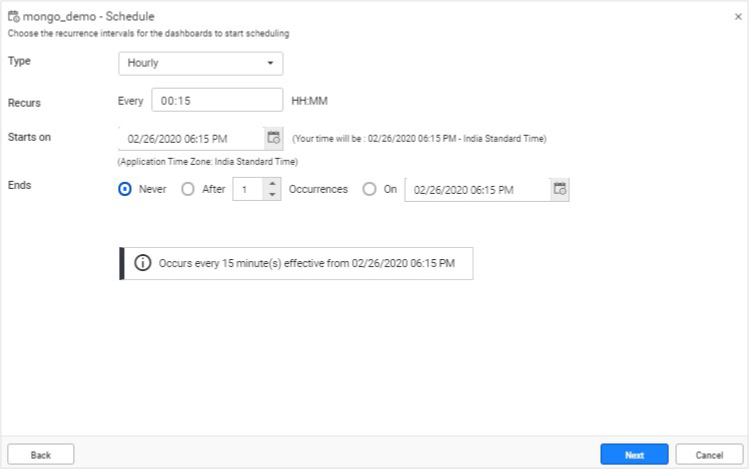
Bold BI supports scheduled refreshes for both dashboards and data sources. It supports refreshing as often as every 5 minutes.
Share with others
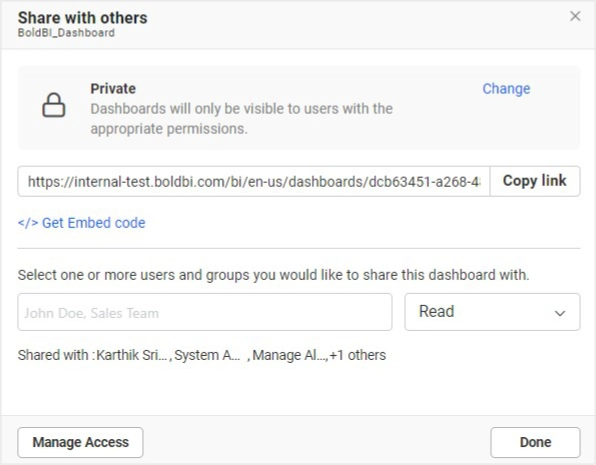
Bold BI allows you to share your dashboards so that they’re visible only to selected users or the public. You can also set permissions for every user.
Data transformation
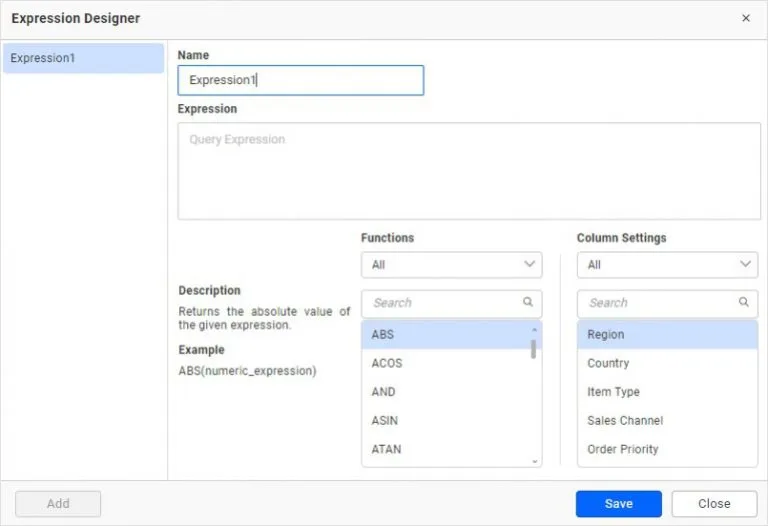
Bold BI bundles 60+ expressions and filters for effective data transformation. You can also transform your data into other data types, such as date, number, and string.
TV dashboards
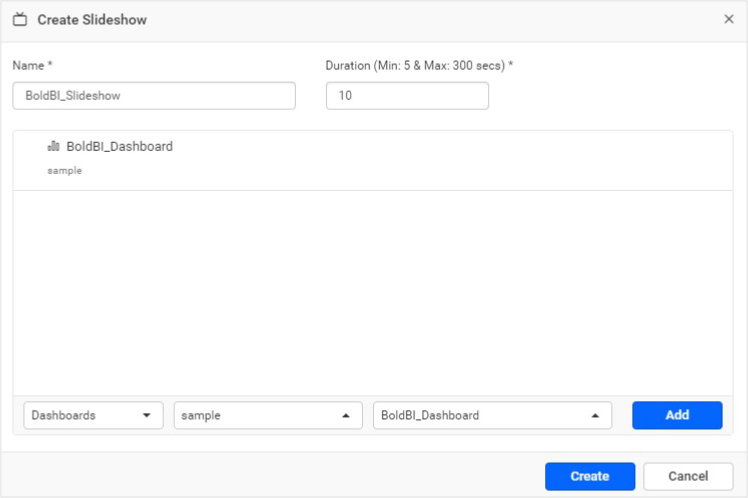
Bold BI lets you display your dashboard visuals as a slideshow, making them a perfect fit for TVs and other large screens. Every slide can be displayed for as briefly as 5 seconds or up to a maximum of 300 seconds.
Thus, I feel these should be the deciding factors to convince anyone to choose Bold BI® as their dashboarding solution. If you have any questions on this blog, please feel free to post them in the following comment section. Get started with Bold BI by signing up for a free trial and create more interactive business intelligence dashboards. You can also contact us by submitting your questions through the Bold BI website or, if you already have an account, you can log in to submit your support question.





