-
Empower Finance Departments with Embedded Analytics
 This blog explains how embedded analytics improves financial management by integrating dashboards into everyday workflows. Shows how embedding the Budget vs. Actual Dashboard enables real-time financial insights for better decision-making.
-
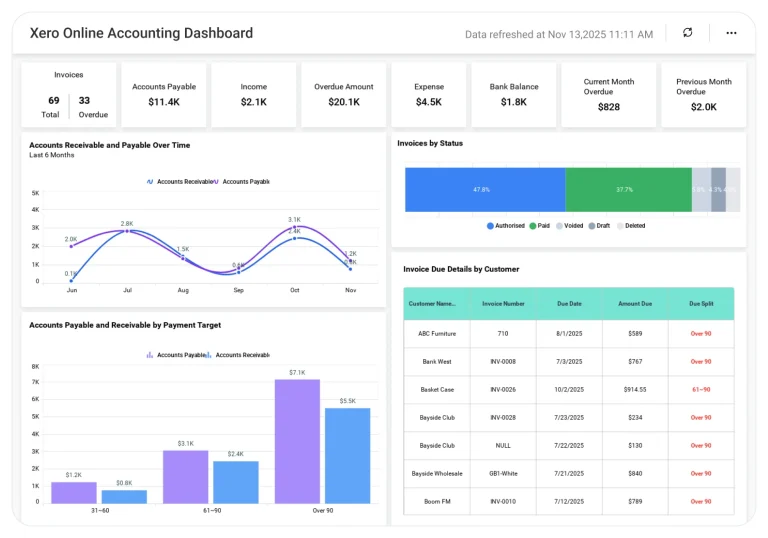
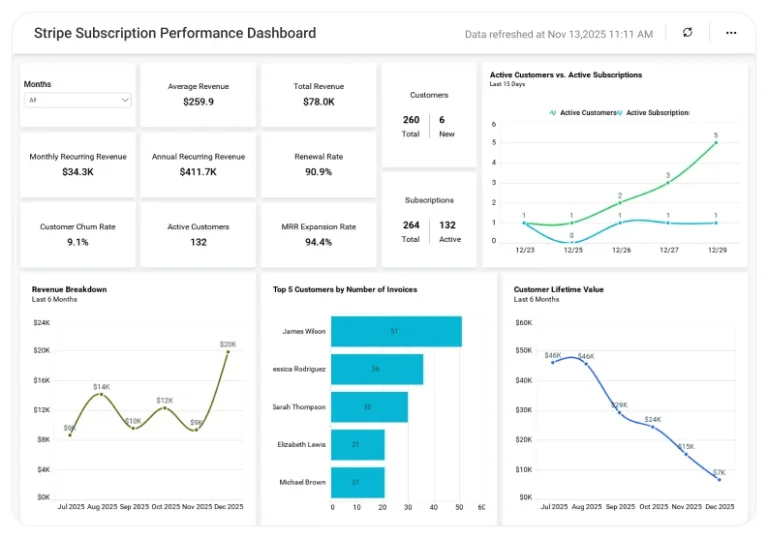
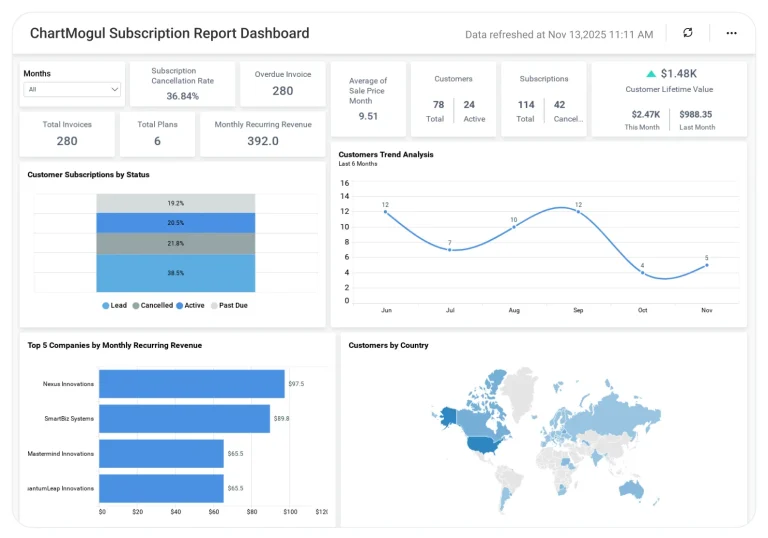
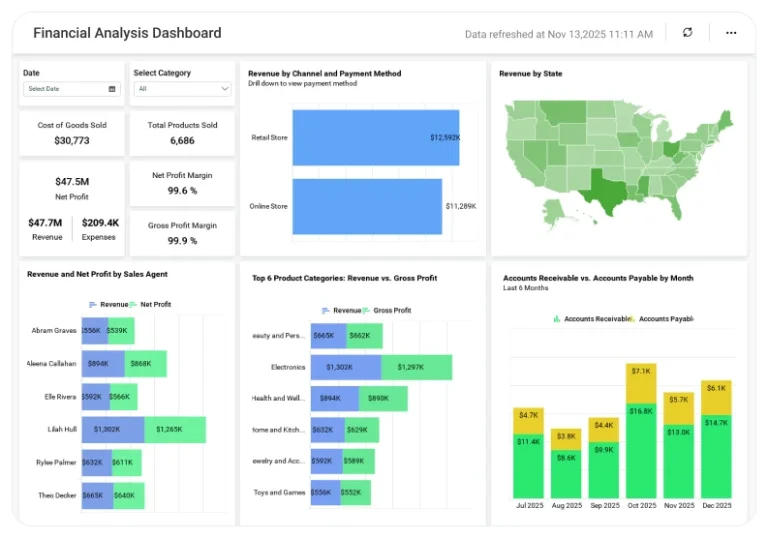
Top 10 Finance Dashboards for Global Businesses
This blog highlights ten powerful finance dashboard examples designed for global businesses. It serves as a guide for selecting and implementing dashboards that improve efficiency and transparency in global finance operations.
-
How to Build a Budget vs. Actual Dashboard in Bold BI
This video will guide you through adding and configuring widgets on a budget versus actual dashboard in Bold BI. It includes setting up the text, KPI cards, a radial gauge, column charts, and grid widgets.