
Retail Sales Sell-In Dashboard
Improve upstream sales visibility, align inventory with demand, and drive margin‑aware growth across channels with clear sell‑in insights.
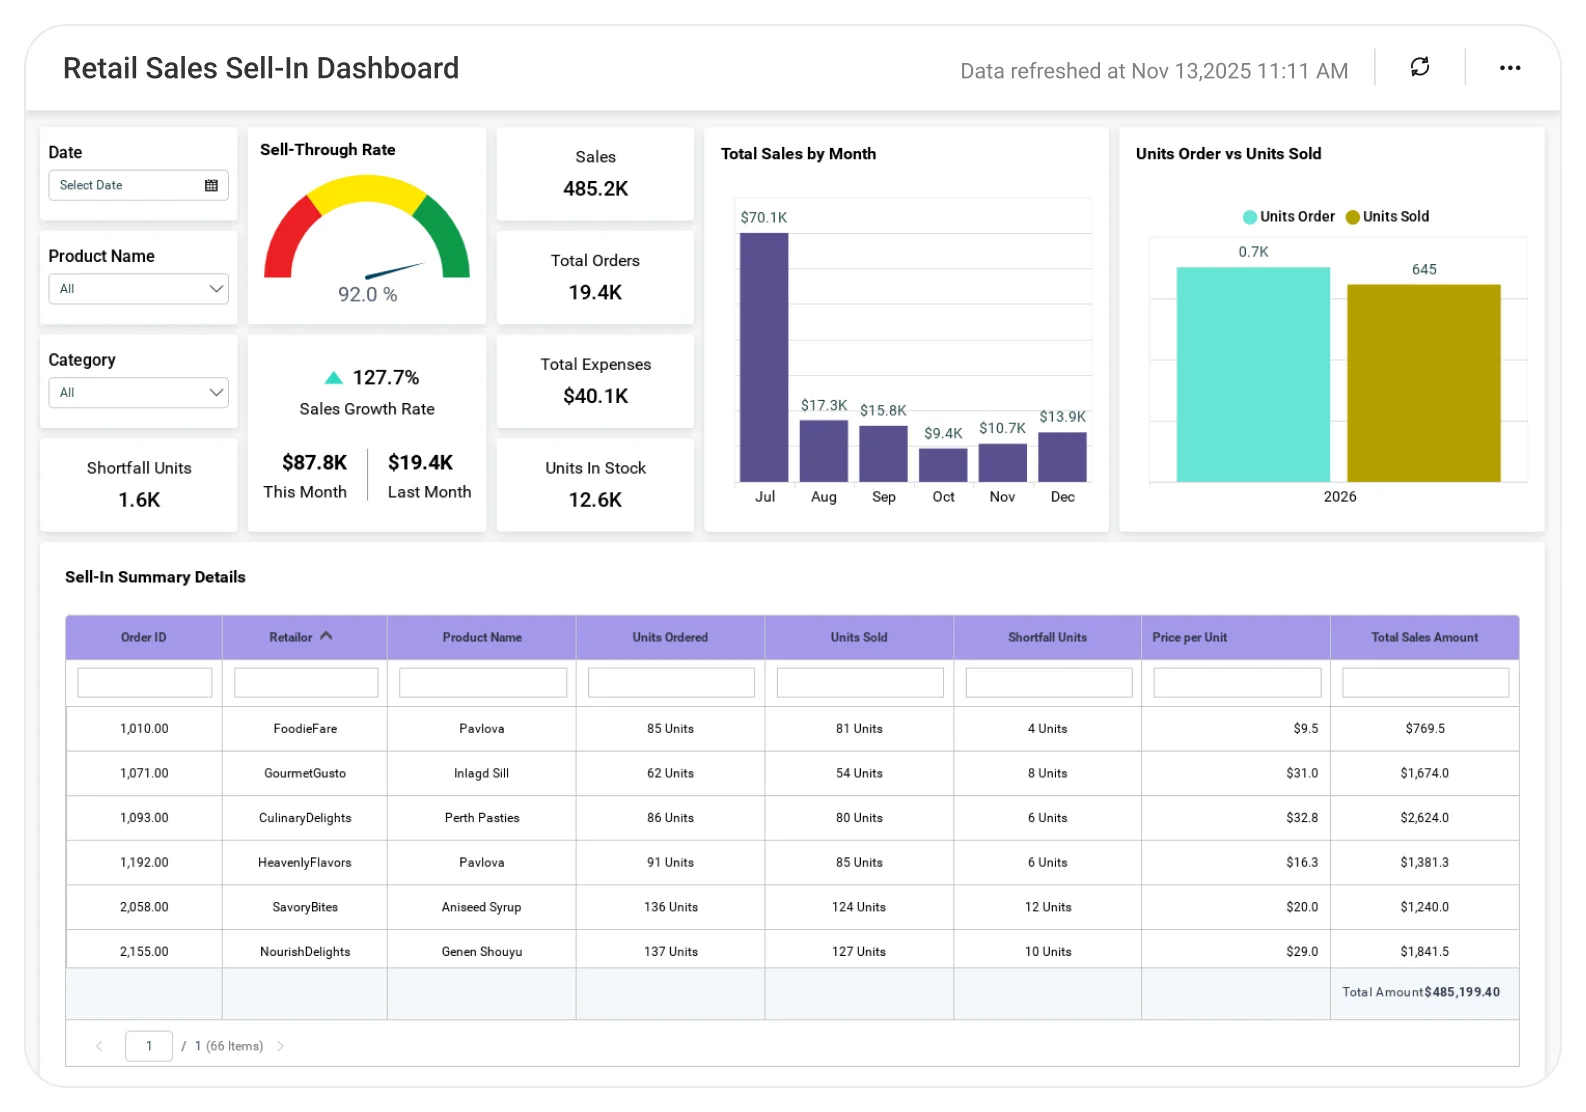
The Retail Sales Sell‑In Dashboard helps omnichannel retailers and D2C brands understand how products enter the business so merchandising, supply chain, and finance teams can plan inventory, pricing, and promotions with confidence.
TL;DR
-
Track sell-in volume and value trends by SKU and category to understand inbound inventory flow.
-
Monitor supplier- and source-wise inflow performance to evaluate buying effectiveness.
-
Identify inventory health risks early using DOS, aging, and overstock indicators tied to sell-in.
-
Analyze category and SKU contribution to margin and availability to guide buying decisions.
-
Align inventory planning with demand and margin goals using data-driven sell-in insights.
What Is a Retail Sales Sell-In Dashboard?
A Retail Sales Sell‑In Dashboard is an analytics solution that tracks how inventory enters the retail ecosystem through suppliers, purchase orders, or internal transfers before it reaches stores or eCommerce channels.
With Bold BI, sell‑in data from ERP, WMS/OMS, POS, and eCommerce systems is unified into a single analytical view, helping retailers connect inbound supply decisions with downstream sales, inventory health, and margin outcomes.
Why Retail Sales Sell-In Dashboard Matters
Sell-in decisions determine inventory availability and cash flow well before products reach stores or eCommerce.
When sell-in data is siloed across systems:
-
Overbuying leads to aged inventory and markdown pressure.
-
Underbuying causes stockouts and lost sales.
-
Merchandising and supply teams work with conflicting numbers.
-
Margin erosion is discovered too late.
A centralized sell-in dashboard enables retailers to move from reactive replenishment to proactive, demand-aligned inventory planning.
What You’ll Track
Using Bold BI dashboards, you will track important KPIs such as:
-
Sell-in volume & value: Units and cost/value of inventory entering the business by category and SKU.
-
Category & SKU contribution: Sell-in mix by product to understand assortment and buying emphasis.
-
Inventory health indicators: Days of Supply (DOS), potential overstock, and aged inventory risk linked to sell-in patterns.
-
Channel readiness signals: Alignment of sell-in quantities with store and eCommerce demand patterns.
All samples are easy to tailor, and you can add your own KPIs or connect data from any department.
How It Works
From data connection to live dashboards in hours, not weeks.
-
Apply the Retail Sales Sell-In Dashboard sample.
-
Combine purchase, inventory, and product master data into a unified model.
-
Analyze insights by region, store, channel, category, or SKU.
-
Share dashboards with merchandising, supply chain, finance, and operations teams.
Why Bold BI Is the Right Fit for Retail Sales Sell-In Analytics
-
Aligns buying decisions with omnichannel demand reality: Helps merchandising and planning teams understand whether inbound inventory matches actual store and online demand.
-
Reduces margin pressure from overbuying: Highlights early signals of excess inventory and aged stock risk before markdowns become unavoidable.
-
Improves inventory availability and OTIF outcomes: Supports better coordination between supply, fulfillment, and store operations to reduce stockouts.
-
Connects sell-in decisions to financial performance: Links inbound inventory value with margin %, working capital impact, and revenue contribution.
-
Scales across large, multi-store and digital-first retail models: Designed for retailers managing hundreds of stores, multiple channels, and thousands of SKUs.
Compare Options (at a glance)
| Feature | Bold BI | ERP Reports | Spreadsheets |
| Sell-in analytics & trends | Yes | Limited | Manual |
| SKU & category-level insights | Yes | Partial | Manual |
| Inventory health linkage (DOS/aging) | Yes | Limited | Manual |
| Omnichannel visibility | Yes | Limited | No |
| Custom KPIs & drilldowns | Fully customizable | Fixed | Manual |


