
Student Performance Dashboard
Understand student performance to improve learning outcomes and academic achievement.
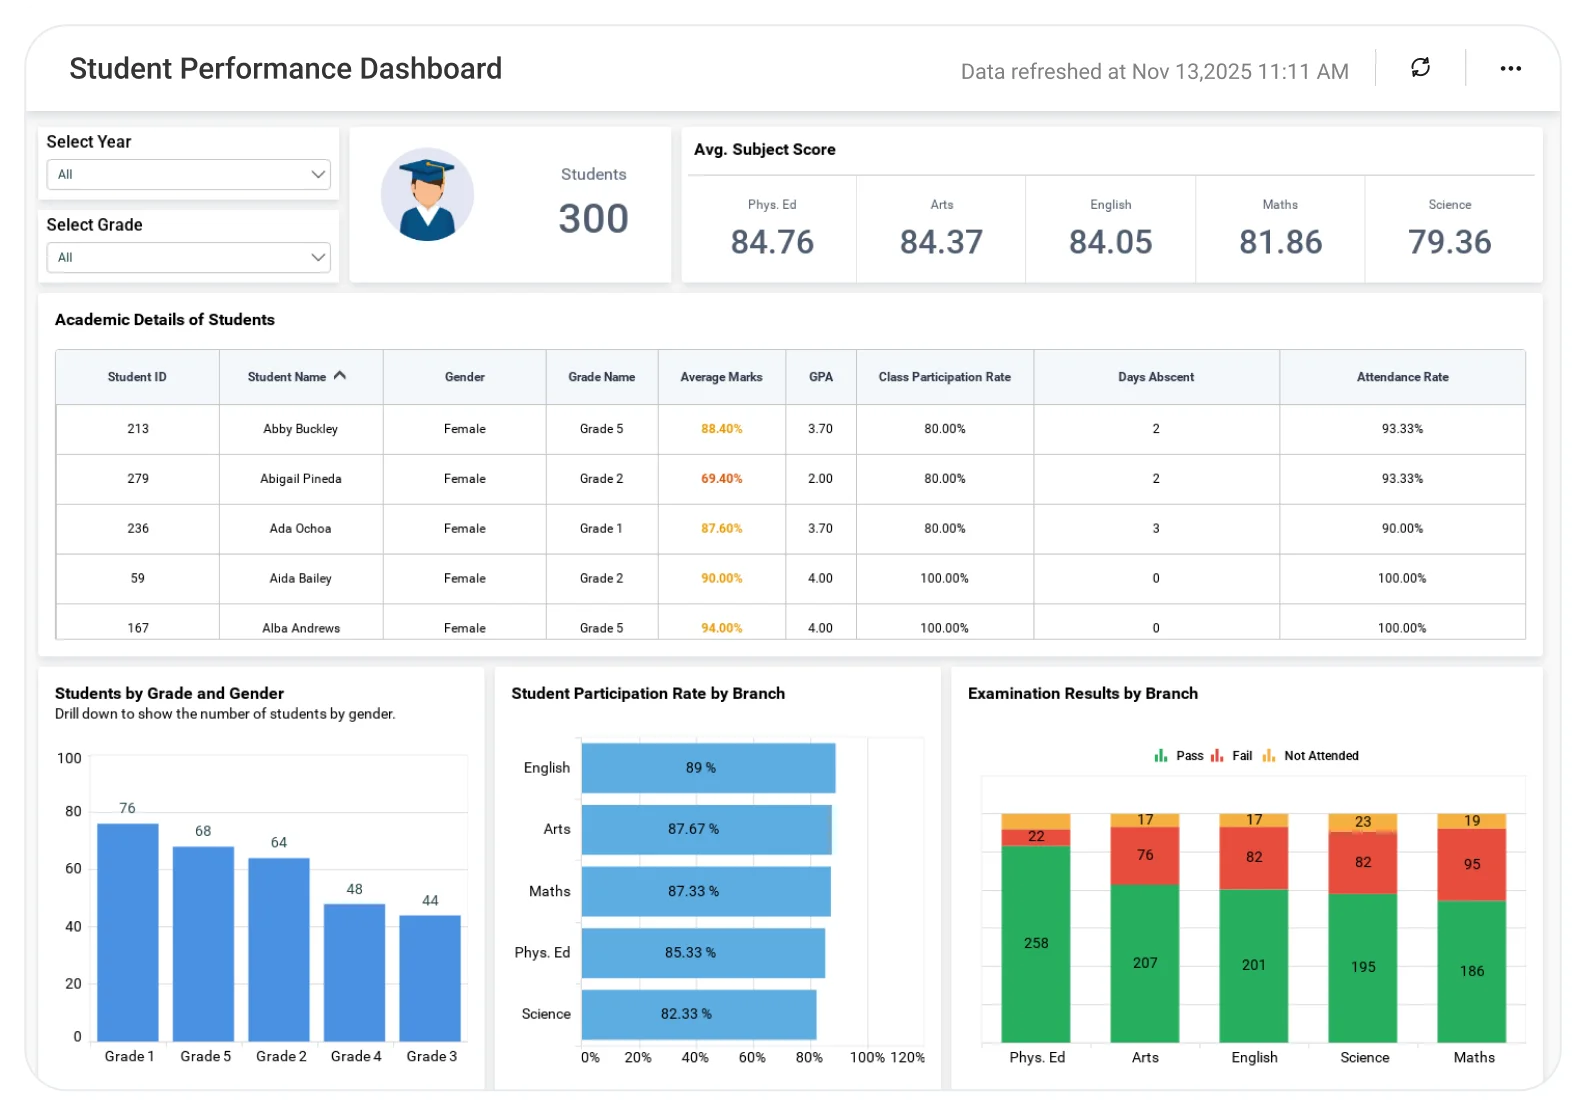
The Student Performance Dashboard helps educators analyze grades, assessments, attendance, and progress trends, enabling timely interventions, personalized support, and improved student success.
TL;DR
-
Multi-year academic insights across attendance, grades, and exam results to spot performance trends early.
-
Deep drill-down analysis by grade, gender, subject, and academic year for targeted academic decisions.
-
Real-time enrollment visibility with clear views of student counts and demographic distribution.
-
Executive-ready summaries showing average subject scores, GPA distribution, and student-level details.
-
Interactive filtering to segment data by year, grade, and demographics for faster, focused analysis.
What is a Student Performance Dashboard?
A Student Performance Dashboard helps educators spot learning gaps early and act—before students to fall behind.
With Bold BI, schools can:
-
Visualize attendance, grades, exam results, and demographic trends.
-
Identify learning gaps early.
-
Support teachers with actionable insights.
-
Filter data by grade, year, or demographic group.
It’s the foundation for improving classroom outcomes and supporting student growth.
Why Student Performance Dashboard Matters
Student performance data is often scattered across grades, attendance systems, and assessment reports, making it difficult for educators to see the full picture. Without a unified view, learning gaps, attendance issues, or declining performance trends can go unnoticed until it’s too late.
A Student Performance Dashboard brings academic results, attendance, and student demographics together in one place. This helps schools identify at-risk students early, measure learning outcomes accurately, and support data-driven interventions that improve overall academic performance.
What You’ll Track
-
Enrollment & attendance: Monitor total enrollment and student attendance percentages by grade and year to assess academic stability and engagement.
-
Grades & examination results: Track pass, fail, and not-attended counts by subject, along with average scores to identify curriculum areas needing support.
-
Demographic distribution: Analyze student counts by grade and gender using multi-level drill-downs—from grade-level totals to gender-wise and deeper demographic insights.
-
Academic trends over time: Compare GPA patterns, subject performance, and attendance trends across multiple years or classroom groups to gauge improvement.
-
Student-level performance details: Review individual student profiles including name, grade, gender, GPA, average marks, attendance percentage, and exam results for targeted support planning.
-
Time & grade-based filtering: Use year and grade filters to focus on specific cohorts, compare academic performance across periods, or reset to view overall trends.
All dashboards are fully customizable. You can add KPIs, adjust thresholds, and combine academic, attendance, and demographic data.
How It Works
Bold BI connects your academic and student data sources and transforms them into interactive dashboards.
-
Connect your data: Integrate SIS platforms, exam results, attendance records, Excel, or SQL databases.
-
Auto-refresh insights: Dashboards stay up to date with the latest student data—no manual reports required.
-
Explore with drilldowns: Navigate from school-level metrics to class-level and individual student performance.
-
Secure sharing: Use role-based access so teachers, coordinators, and administrators see only what they need.
This workflow enables schools to move from raw data to actionable academic insights quickly and securely.
Why Bold BI Is the Right Fit for Student Performance Analytics
-
Deep student-level drilldowns: Move seamlessly from school-wide performance metrics to class-level and individual student insights.
-
Self-service analytics for educators: Enable teachers, principals, and academic coordinators to explore data without manual reports or spreadsheets.
-
Secure & governed sharing: Protect student data using Row Level Security(RLS), Single Sign On(SSO), Role Based Access Control(RBAC), and audit logs.
Compare Options (at a glance)
| Feature | Bold BI | SIS/LMS Built-in Reports | Spreadsheets |
|---|---|---|---|
| Grades & GPA trends over time | Yes | Limited | Manual |
| Attendance monitoring & chronic absence tracking | Yes | Partial | Manual |
| Assessment analysis (standards mastery, question difficulty) | Yes | Limited | Manual |
| Cohort comparisons (class/grade/teacher/demographic) | Yes | Partial | Manual |
| Early-warning risk indicators (at-risk students, intervention impact) | Yes | Limited | Manual |
| Behavior/discipline trends & correlation to outcomes | Yes | Limited | Manual |
| Custom KPIs & dashboards | Fully customizable | Fixed | Manual |
Frequently Asked Questions
More Articles About Student Performance Dashboard
-
Educational Insights: Analyzing Student Performance with BI Dashboards:
 Explore how BI dashboards help teachers track grades, attendance, and trends for better student outcomes.
-
What Is Embedded Analytics? Benefits, Examples, and Uses:
Learn how embedded analytics empowers schools with real-time insights, improving decisions, and academic success.


