Industry : Education

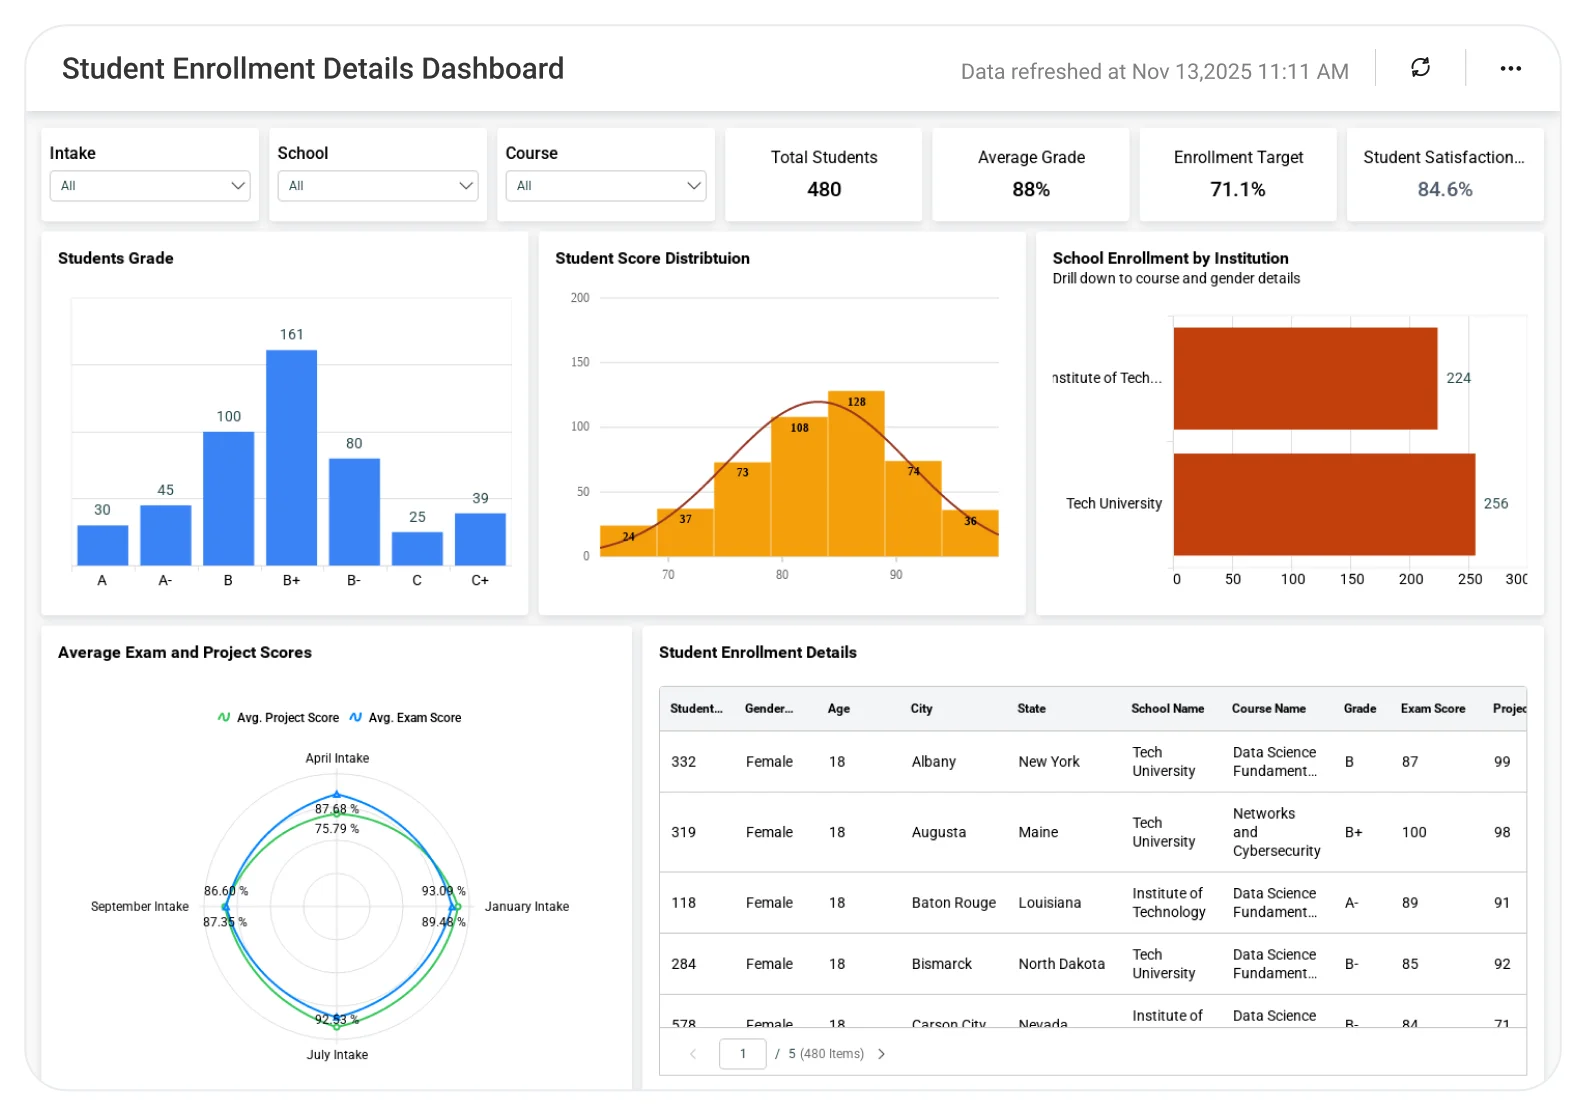
Student Enrollment Details Dashboard

Improve enrollment planning accuracy, identify demand trends early, and support data‑driven academic and financial decisions across institutions.

The Student Enrollment Details Dashboard gives universities and school districts a single view of enrollment volume, program demand, demographics, and historical trends, helping leadership plan capacity, allocate resources, and respond proactively to enrollment changes.

TL;DR

  • Track overall student enrollment trends across years and terms to understand growth or decline patterns.
  • Analyze program-, department-, and campus-wise enrollment distribution to identify demand shifts.
  • Monitor demographic and category-based enrollment breakdowns to support equity, compliance, and planning.
  • Compare new vs continuing student enrollment patterns to assess pipeline health and retention signals.
  • Support proactive academic, capacity, and financial planning with data-driven enrollment insights.

What Is a Student Enrollment Details Dashboard?

A Student Enrollment Details Dashboard is an analytics solution that provides a clear, consolidated view of who is enrolling, where demand is increasing or declining, and how enrollment patterns change over time.

With Bold BI, enrollment data from SIS, ERP, and related academic systems is unified into interactive dashboards, helping institutions move beyond static reports toward insight‑driven enrollment strategy and planning.

Why Student Enrollment Details Dashboard Matters

Enrollment trends directly influence academic planning, staffing, funding, and long-term institutional sustainability. 

When enrollment data is scattered across departments or systems: 

  • Program demand signals are missed.
  • Capacity planning becomes reactive.
  • Budget forecasts lack accuracy.
  • Leadership decisions rely on delayed reports.

A centralized enrollment dashboard helps institutions move from delayed, retrospective reports to proactive enrollment planning. 

What You’ll Track

Using Bold BI dashboards, you will track important KPIs such as: 

  • Total enrollment trends: Student enrollment by academic year or term to understand growth or decline patterns.
  • Program & department demand: Enrollment distribution across programs, colleges, or schools to support capacity planning.
  • Student demographics & categories: Enrollment by gender, residency, category, or other attributes to support equity and compliance needs.
  • New vs continuing students: Breakdown of first-time enrollments versus returning students to assess pipeline health.

All dashboards are fully customizable, allowing you to add KPIs or metrics as needed.

How It Works

  • Connect Student Information Systems (SIS), ERP, or data warehouse sources to Bold BI.
  • Apply the Student Enrollment Details Dashboard sample.
  • Combine enrollment, academic structure, and student attribute data in one unified model.
  • Analyze insights by campus, college, program, or academic year.
  • Share dashboards with academic leadership and planning teams.

Why Bold BI Is the Right Fit for Enrollment & Academic Planning Analytics

  • Supports institution-wide enrollment visibility without silos: Unifies enrollment data across campuses, colleges, and programs, helping leadership see the full enrollment picture instead of fragmented views.
  • Enables proactive academic and capacity planning: Highlights program-level demand trends early, allowing institutions to plan faculty load, classrooms, and course offerings more effectively.
  • Improves financial and resource forecasting accuracy: Enrollment insights directly support budgeting, staffing decisions, and funding projections for finance and academic leadership.
  • Strengthens compliance and accreditation readiness: Provides consistent, drillable enrollment metrics required for audits, accreditation reviews, and regulatory reporting.
  • Scales across districts and multi-campus university systems: Designed to support large institutions and school districts with multi-entity drilldowns and role-based access.

Compare Options (at a glance)

Feature Bold BI SIS Reports Spreadsheets
Enrollment trend analytics Yes Limited Manual
Program & campus drilldowns Yes Partial Manual
Demographic & category analysis Yes Limited Manual
Multi-year comparison Yes Limited No
Custom KPIs & dashboards Fully customizable Fixed Manual


Frequently Asked Questions

Yes. Enrollment can be analyzed at district, campus, college, or program level with drilldowns for detailed review.
Absolutely. Academic leaders use it for planning and capacity decisions, while finance teams rely on it for enrollment-driven budgeting.
Yes. Historical enrollment trends help institutions understand long-term growth patterns and seasonal fluctuations.
Yes. Program-wise enrollment distribution clearly highlights areas of rising demand or enrollment risk.
Yes. Centralized dashboards replace spreadsheet-based reporting and repetitive data preparation.
Yes. Consistent enrollment metrics with drilldowns support data validation and audit-ready reporting.

More Articles About Student Enrollment Details Dashboard

Compare Options (at a glance)

Feature Bold BI SIS Reports Spreadsheets
Enrollment trend analytics Yes Limited Manual
Program & campus drilldowns Yes Partial Manual
Demographic & category analysis Yes Limited Manual
Multi-year comparison Yes Limited No
Custom KPIs & dashboards Fully customizable Fixed Manual


Simple Pricing That Grows With You

Say goodbye to hidden costs, complex quotes, and pricing guesswork. 

Trusted by Users. Recognized by Experts.

Don't take our word for it

Here are a few kind words from some of our happy customers.

Software Advice

Frequently Asked Questions

Yes. Enrollment can be analyzed at district, campus, college, or program level with drilldowns for detailed review.
Absolutely. Academic leaders use it for planning and capacity decisions, while finance teams rely on it for enrollment-driven budgeting.
Yes. Historical enrollment trends help institutions understand long-term growth patterns and seasonal fluctuations.
Yes. Program-wise enrollment distribution clearly highlights areas of rising demand or enrollment risk.
Yes. Centralized dashboards replace spreadsheet-based reporting and repetitive data preparation.
Yes. Consistent enrollment metrics with drilldowns support data validation and audit-ready reporting.

Start your 30-day free trial instantly

Easy integration, AI-Powered Dashboards and 24x5 real-time support.