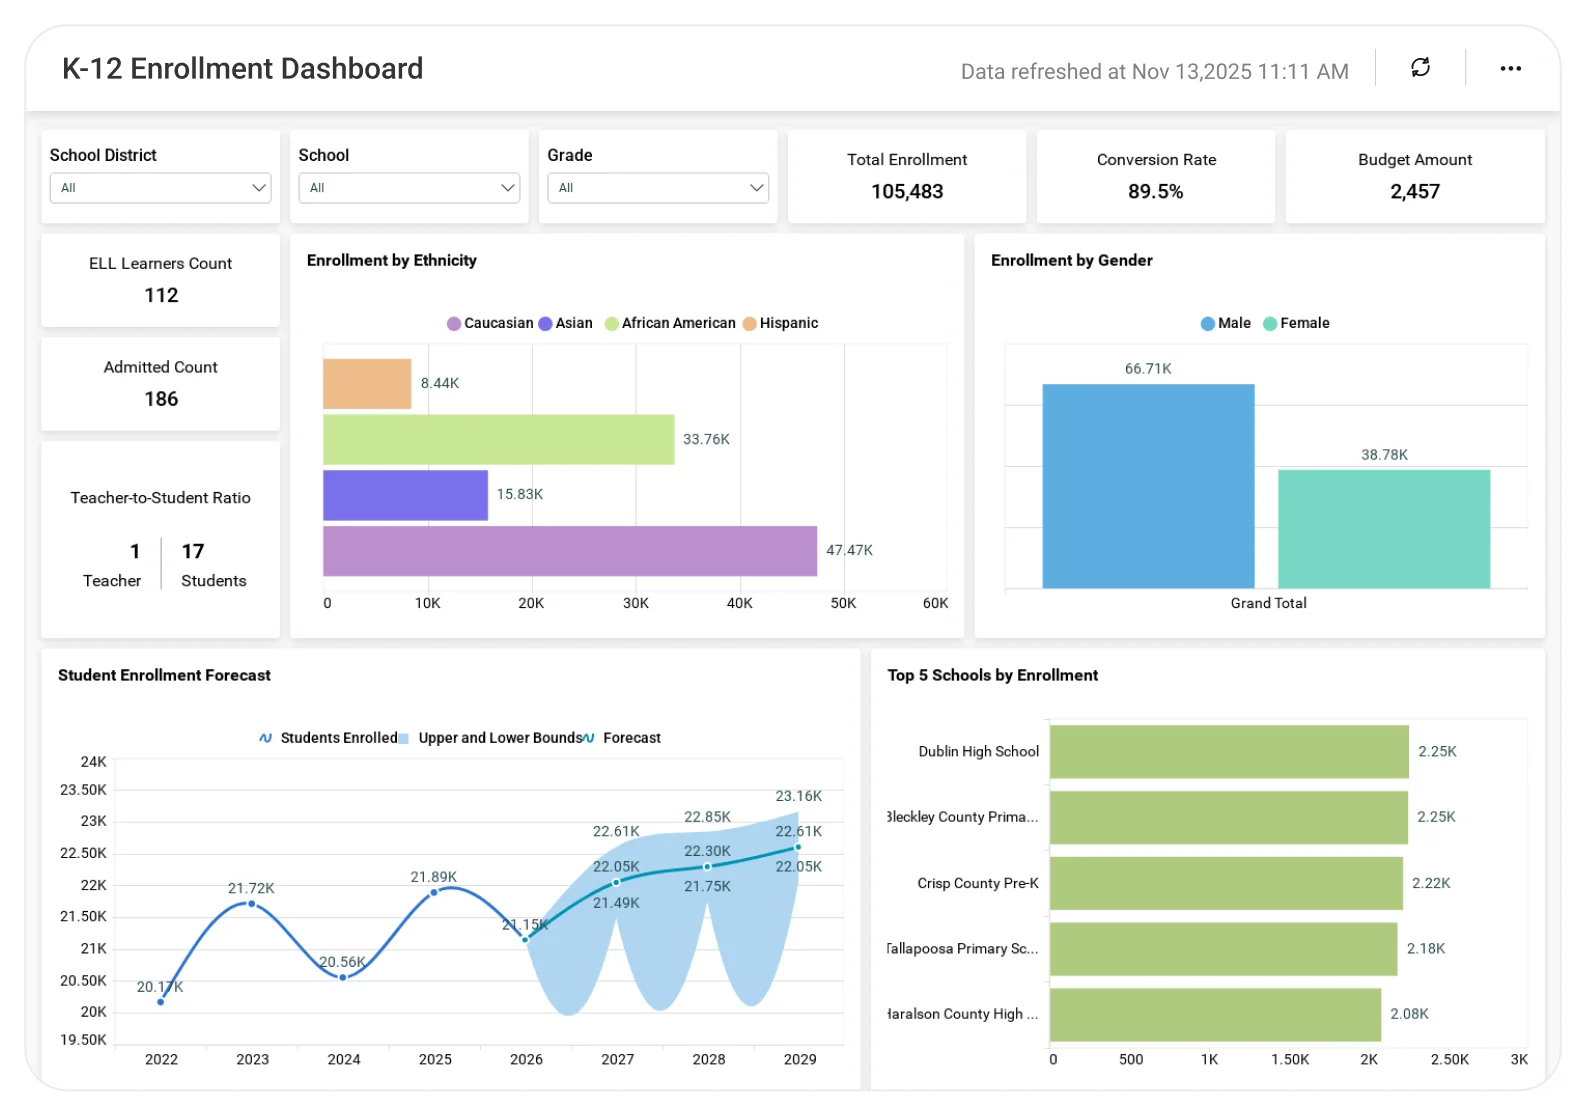
K-12 Enrollment Dashboard
Understand enrollment trends to plan capacity, staffing, and resources effectively.
The K-12 Enrollment Dashboard helps school administrators analyze student enrollment by grade, school, and academic year, enabling better resource planning, balanced classroom capacity, and informed district-level decisions.
TL;DR
-
Faculty-to-student ratio.
-
Year-over-year enrollment trends.
-
Enrollment forecast for the next three years.
-
Students enrolled in advanced courses.
-
Annual operating budget trends.
What Is a K-12 Enrollment Dashboard?
A K‑12 Enrollment Dashboard is a visual analytics solution that helps school and district leaders monitor enrollment patterns, staffing ratios, academic participation, and budget trends over time.
In Bold BI, it becomes an interactive dashboard with KPIs, charts, and filters, automatically updated from education data sources.
Why K-12 Enrollment Dashboard Matters
K-12 leaders must plan staffing, budgets, and academic programs while responding to changing enrollment patterns.
Without a centralized dashboard:
-
Enrollment shifts are identified too late.
-
Staffing and budget planning have become reactive.
-
Advanced program participation is hard to track.
Bold BI brings enrollment, academic, and financial data into one dashboard so leaders can plan confidently.
What You’ll Track
-
Enrollment trends & forecasts: Year-over-year enrollment changes with a three-year enrollment forecast to support future planning.
-
Staffing efficiency: Faculty-to-student ratio to evaluate staffing levels across districts and schools.
-
Advanced coursework participation: Number of students enrolled in acceleration or advanced programs by year.
-
Budget performance: Annual operating budget trends to understand funding changes over time.
-
Trends & comparisons: Compare enrollment, coursework participation, and budget metrics across years, districts, schools, and grade levels using interactive filters.
All dashboards are fully customizable, allowing you to add KPIs or metrics as needed.
How It Works
-
Select the K-12 Enrollment Dashboard sample.
-
Blend enrollment, attendance, retention, and demographic data in one view.
-
Share role-based dashboards with district leaders, principals, and administrators.
-
Track enrollment trends, identify risks early, and support data-driven planning.
Why Bold BI Is the Right Fit for K-12 Enrollment Analytics
-
Centralize district-level reporting: Combines enrollment, staffing, coursework, and budget metrics in one place.
-
Support long-term planning: Enables trend analysis and forecasting across multiple academic years.
-
Deploy flexibly:Supports cloud and self-hosted deployment to match district needs.
-
Enable broad visibility: Share enrollment, staffing, and budget insights across districts, schools, and leadership teams.
Compare Options (at a glance)
| Feature | Bold BI | District Reports | Spreadsheets |
| Enrollment trend tracking | Yes | Limited | Manual |
| Enrollment forecasting | Yes | No | No |
| Advanced coursework analysis | Yes | Limited | Manual |
| Interactive filters & drilldowns | Yes | Limited | No |
| Executive-ready dashboards | Yes | Limited | No |
Frequently Asked Questions
More Articles About K-12 Education & Enrollment Analytics
-
Improve K-12 Enrollment & Performance by Embedded Analytics
 Explains how K-12 institutions can use interactive dashboards to track enrollment trends, staffing ratios, academic participation, and budget performance, helping districts move from static reports to data-driven planning and forecasting.