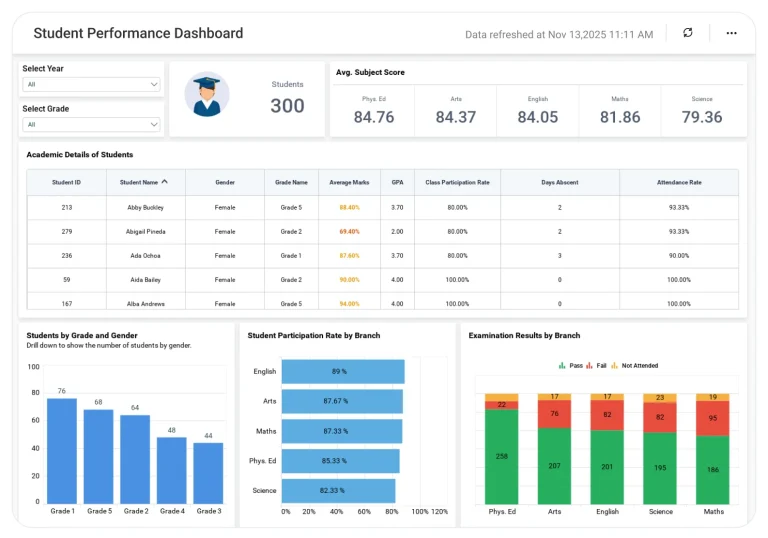
Student Profile Dashboard
View academic, demographic, and enrollment information for each student in one dashboard to support student‑centric decisions.
The Student Profile Dashboard gives universities and school districts a single view of each student’s academic, demographic, and engagement information, helping advisors and administrators personalize support and intervene earlier.

TL;DR
-
View individual student academic and demographic profiles to understand each student’s context quickly.
-
Track enrollment status, program affiliation, and progression indicators to monitor student journeys.
-
Analyze student distribution by category, program, or institution to support planning and reporting.
-
Access population-level student insights alongside individual profiles for balanced micro- and macro-level decisions.
-
Enable personalized advising and proactive academic support with data-driven student visibility.
What Is a Student Profile Dashboard?
A Student Profile Dashboard is an analytics solution that provides a consolidated view of each student’s core information, combining enrollment data, academic structure, and demographic attributes into a single, accessible profile.
With Bold BI, data from SIS, ERP, LMS, and related education systems is unified to give institutions a consistent and reliable view of students, supporting advising, reporting, and data‑informed academic planning.
Why Student Profile Analytics Dashboard Matters
Student data is often fragmented across multiple academic and administrative systems.
When institutions lack a unified student view:
-
Advisors struggle to understand student context quickly.
-
Academic risks go unnoticed until late stages.
-
Reporting becomes time-consuming and inconsistent.
-
Student support efforts remain reactive.
A centralized student profile dashboard replaces siloed records with a holistic, student-centric view across systems.
What You’ll Track
Using Bold BI dashboards, you will track important KPIs such as:
-
Student enrollment details: Program, department, campus, and academic year information for each student.
-
Demographic distribution: Student profiles by gender, category, residency, or other institutional attributes.
-
Academic structure alignment: Student association with colleges, departments, and programs for planning and reporting.
-
Population-level student insights: Aggregated views of student profiles to understand composition and trends.
All dashboards are fully customizable, allowing you to add KPIs or metrics as needed.
How It Works
-
Connect Student Information Systems (SIS), ERP, or data warehouse sources to Bold BI.
-
Apply the Student Profile Dashboard sample.
-
Combine student, academic structure, and demographic data into a unified model.
-
Analyze insights at individual or aggregated student levels.
-
Share dashboards with advisors, academic leaders, and institutional research teams.
Why Bold BI Is the Right Fit for Student-Centric Education Analytics
-
Creates a single source of truth for student information: Consolidates fragmented student data into consistent profiles accessible across academic and administrative teams.
-
Enables faster, more informed academic advising: Helps advisors quickly understand student context without navigating multiple systems or reports.
-
Supports equity, compliance, and institutional reporting: Makes demographic and category-based student analysis transparent and audit-ready.
-
Scales across districts and multi-campus universities: Designed to support large student populations with campus, college, and program-level drilldowns.
-
Improves collaboration across academic and administrative teams: Ensures everyone works from the same student data foundation when planning interventions or reporting outcomes.
Compare Options (at a glance)
| Feature | Bold BI | SIS Screens | Spreadsheets |
| Unified student profile analytics | Yes | Limited | Manual |
| Demographic & category analysis | Yes | Partial | Manual |
| Campus & program drilldowns | Yes | Limited | Manual |
| Population-level insights | Yes | Limited | No |
| Custom dashboards & KPIs | Fully customizable | Fixed | Manual |