Real-Time Healthcare Dashboards for Smarter, Faster Decisions. Improve patient outcomes, optimize staff workloads, and streamline operations with Bold BI’s customizable healthcare analytics platform, built to give you the insights you need, when you need them.
Bold BI empowers healthcare organizations by offering fully customizable, interactive dashboards that put your most critical KPIs right at your fingertips.
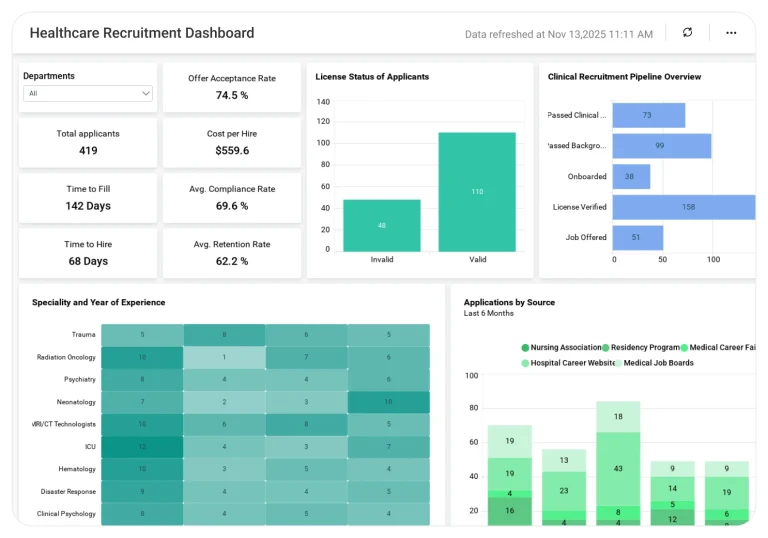
Healthcare Recruitment Dashboard
Gain clear visibility into hiring pipelines for data-driven decisions.
Poison Control KPI Dashboard
Monitor poison exposure trends and clinical impact to enable faster decision-making.
Drug and Substance Abuse Dashboard
Analyze substance abuse trends and impact levels for proactive healthcare decisions.
Radiology Rejection Analysis Dashboard
Analyze rejection rates, root and turnaround time impact for high quality imaging.
Cancer Diagnosis Dashboard
Analyze cancer diagnosis volumes and outcomes for oncology performance management.
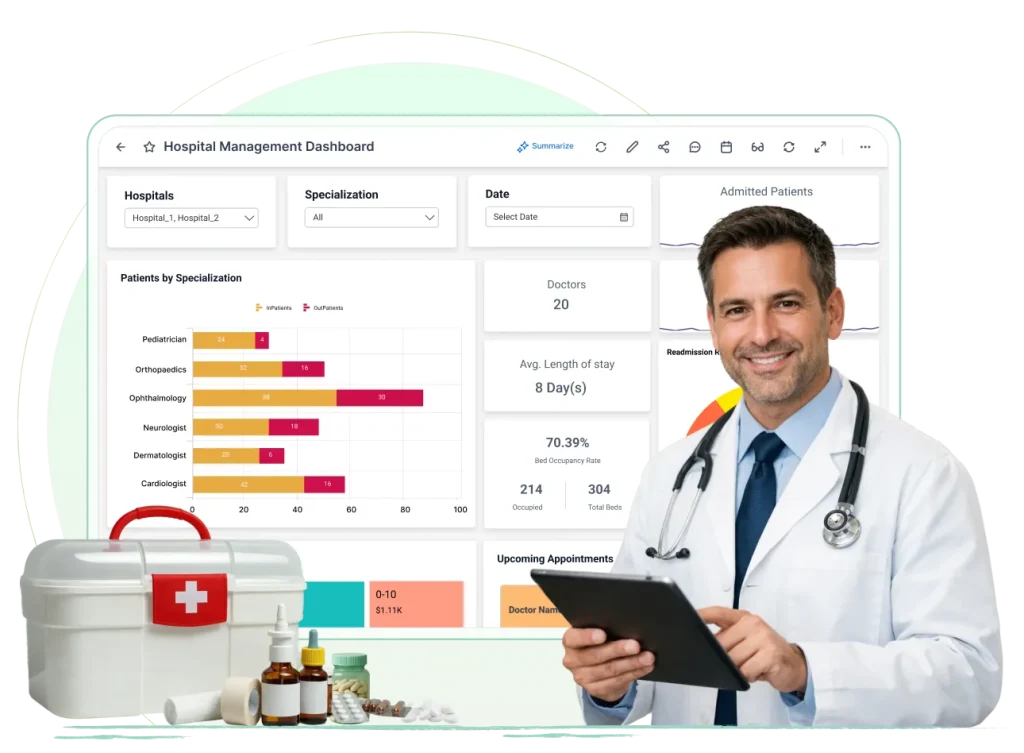
Hospital Management Dashboard
This hospital management dashboard provides a breakdown of crucial staff and patient data. With this dashboard, we can answer the questions...
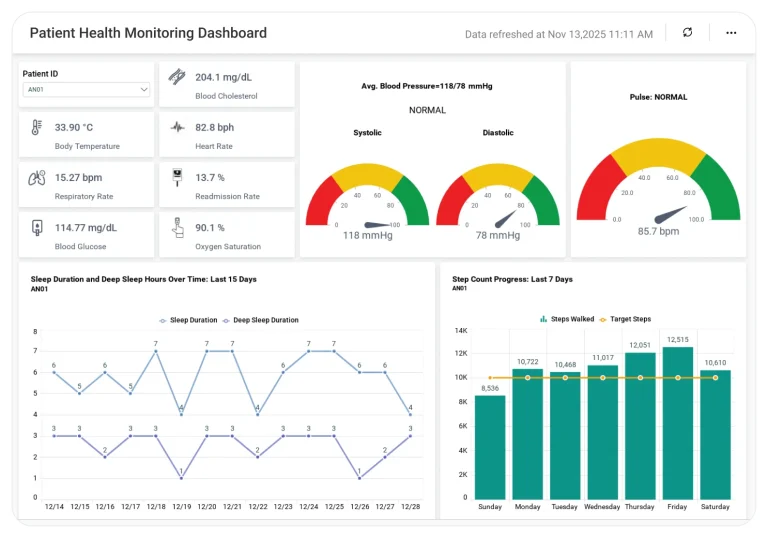
Patient Health Monitoring
Track patients’ vital signs, daily steps, sleep, and more
Patient Experience Analysis
This healthcare dashboard provides a detailed breakdown of patients’ experience.
Coronavirus Disease (COVID-19) Analysis
Track confirmed cases, recovery rates, and more
Clinical Trials Dashboard
Review trials by intervention type, clinical phase, location, and more.
Orthopaedic Clinical Variation Dashboard
Review occupancy and readmission rates, average length of stay, clinical complication data, and more.
Healthcare Executive Dashboard
Easily examine healthcare executive metrics such as the staff to patient ratio, operating revenue and expenses, and equipment utilization rates.
Why Healthcare Teams Choose Bold BI
Real-Time Dashboard KPIs: Keep track on patient flow, bed occupancy, and ER wait times empower teams to improve patient care quality.
Secure health Analytics: Bold BI’s RLS, SSO, RBAC ensure protected health information stays safe.
Predictive Analytics: AI-driven forecasts helpful for patient admissions, staffing needs, and readmission risks for optimized resource planning.
Self-Service analytics for All Roles: Nurses, physicians, and executives can create and customize dashboards without the aid of expertise, saving time and boosting decision-making.
What You’ll Track
Bold BI’s customizable dashboards put the healthcare KPIs you depend on at your fingertips, making it easy to increase your team’s transparency and efficiency.
Operational Metrics: Average wait time, occupancy rate, turnover time.
Financial Metrics: Revenue per case, Cost per patient, Claim approvals.
How It Works
Connect your data from practice management systems, Excel files, SQL database, and billing systems.
Choose a healthcare dashboard sample or start from a blank canvas.
Blend clinical, operational, and financial data. This provides insight into where bottlenecks impact patient care. It also covers how staffing levels affect patient outcomes.
Share role-based views for administrators, clinicians, and department leaders.
Set real-time alerts for risk indicators. Rising readmission rates or increased wait times to get flagged.
Trusted by Users. Recognized by Experts.
Don't take our word for it
Here are a few kind words from some of our happy customers.
I appreciate Bold BI for making it easier to provide reporting for our customers, allowing both our analysts and customers to easily build and publish reports. The ability to build dashboards and modify queries for specific outcomes is very user-friendly. I value the mobile readiness of the app and its integration capabilities with API structures. The addition of AI features is impressive. The economic pricing model and the effective partnership, which includes consistent and helpful support, make it an invaluable tool for our OEM model.
The support from Bold is unmatched. They do not charge extra for support and it is excellent anyway. All our tickets and questions are quickly answered with authoritative and precise guidance. This is important at the product is complex, powerful and mature. To get the most out of the tool, the level of support they provide is essential.
It was easy to implement data visualizations into our product. The standard widgets allowed us to build professional looking dashboards, and a robust API provided excellent control of the development and runtime process from within our application.
I was looking for an solution for internal dashboarding, BoldBI was priced well, easy to understand, and well documented. I mean really well documented. Great deployment options, a JS SDK, and did i mention the documentation?
BoldBI was just right for what i needed, not too complicated, not too simple. I can train users on dashboards, or write my own custom controls. Best of both worlds.
Frequently Asked Questions
It unifies clinical, operational, and financial data. Care teams identify delays and reduce bottlenecks. They monitor quality indicators too. This leads to more informed and timely decisions.
Bold BI supports RLS, SSO, RBAC. Each stakeholder sees only data relevant to their role.
Yes, Bold BI integrates with a wide range of databases, APIs, and healthcare systems that support data export or provide an API; you bring that data into a dashboard.
All samples are fully customizable. Create department specific dashboards for ER, ICU, outpatient clinics, radiology, billing, and more.
Self-hosted deployment keeps data within your network. It supports stricter compliance and security requirements.
Setup takes a short time for most teams. They connect data sources and start visualizing healthcare KPIs within hours. More advanced blending or custom KPIs depend on complexity.
This video shows a step-by-step video building a hospital management dashboard in minutes. Helps teams track bed occupancy, staff ratios, admissions, and costs in real time.
This blog lists must-track KPIs like readmission rates, wait times, and patient satisfaction. Guides hospitals to monitor performance and improve care quality daily.
This blog explains healthcare analytics with real examples (patient flow, claims, outcomes). Shows how real-time dashboards reduce costs and boost patient care.
Start your 30-day free trial instantly
Easy integration, AI-Powered Dashboards and 24x5 real-time support.