Industry : Healthcare

Patient Experience Analysis Dashboard

Understand patient experience trends to improve care quality and satisfaction.

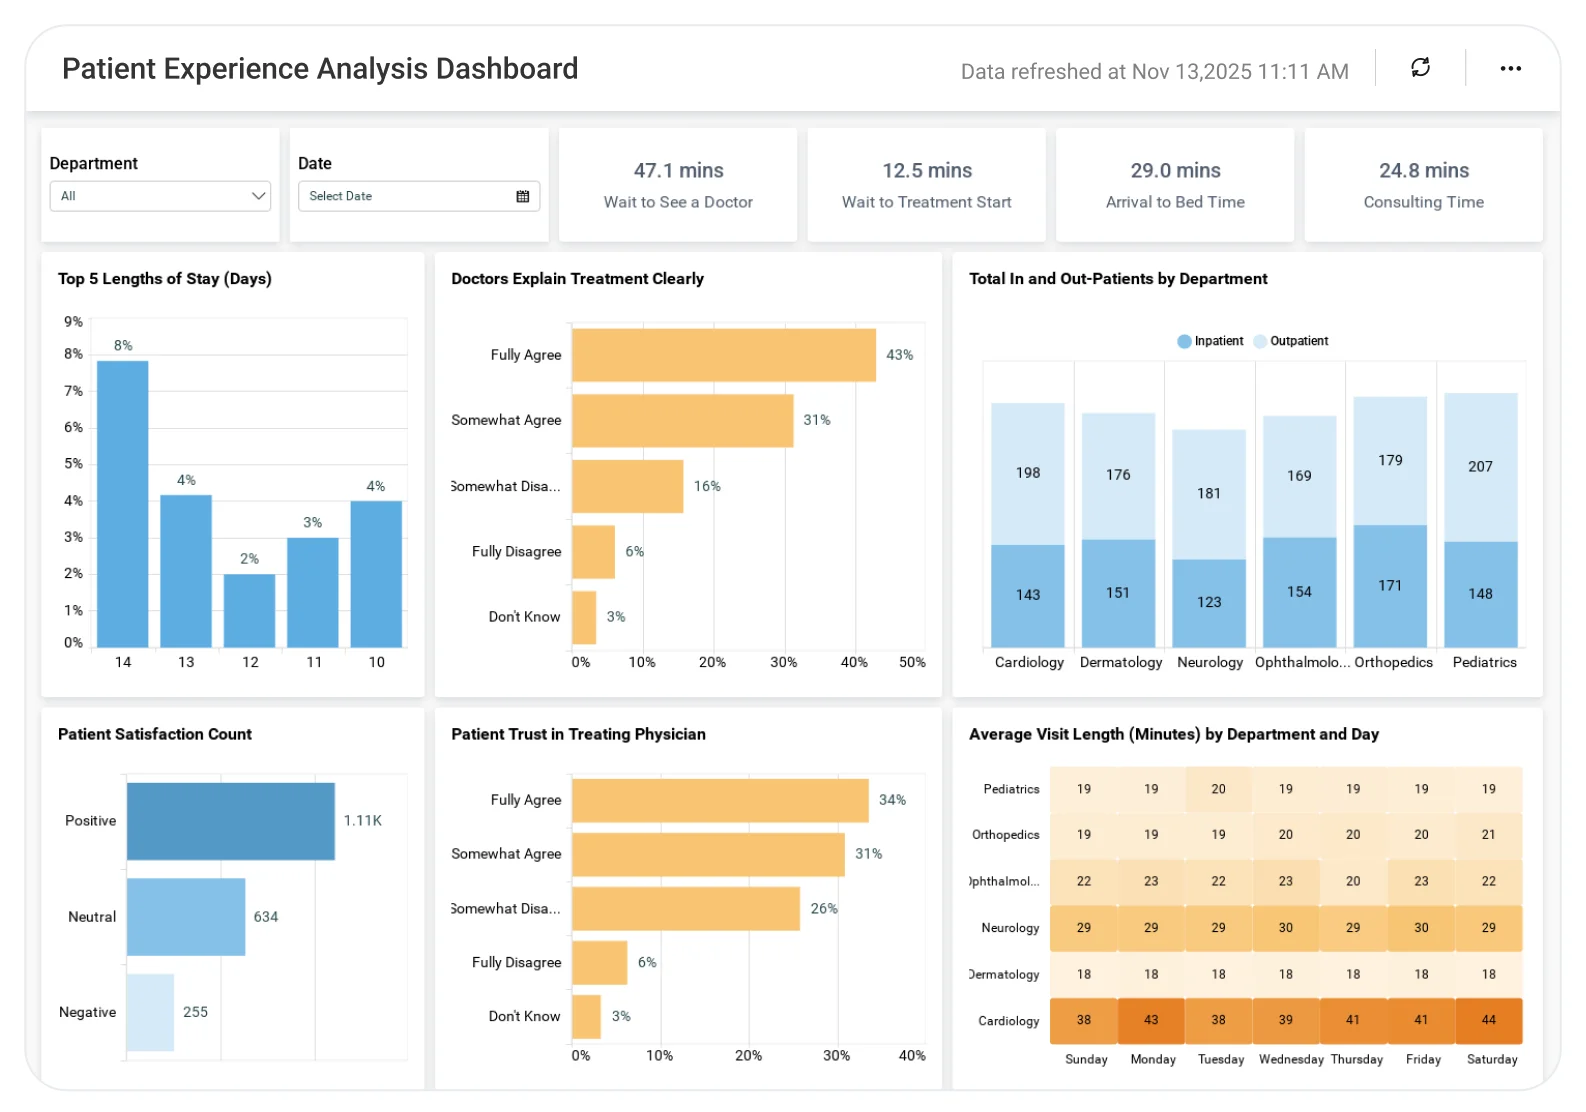
The Patient Experience Dashboard helps healthcare teams analyze patient feedback, service ratings, wait times, and experience indicators, enabling targeted improvements that enhance care delivery and build patient trust.

TL;DR:

  • Patient satisfaction ratings by department.
  • Average patients visit duration.
  • Patients wait time before seeing providers.
  • Department-level experience insights.

What Is a Patient Experience Analysis Dashboard?

A Patient Experience Analysis Dashboard is a visual analytics solution that helps hospitals monitor satisfaction, efficiency, and the overall care experience across departments and time periods.

In Bold BI, it becomes an interactive dashboard with KPIs, charts, and filters that update automatically from patient experience data sources.

Why Patient Experience Analysis Dashboard Matters

Patient experience directly impacts hospital reputation, outcomes, and retention. 

Without a centralized dashboard: 

  • Declining patient satisfaction is hard to detect early.
  • Long waiting times remain hidden.
  • Department-level performance lacks clarity.

Bold BI brings patient feedback and operational metrics into one dashboard so healthcare leaders can take timely, data-driven action. 

What You’ll Track

  • Department-wise satisfaction: Patient satisfaction ratings across hospital departments.
  • Visit duration: Average length of patient visits to understand care efficiency.
  • Wait time analysis: Time patients wait before seeing a provider.
  • Operational patterns: Experience trends by day of week and date range.
  • Demographic insights: Patient experience analyzed by gender and department.

All dashboards are fully customizable, allowing you to add KPIs or metrics as needed.

How It Works

  • Connect Patient data from Excel or SQL sources.
  • Apply the Patient Experience Analysis Dashboard sample.   
  • Monitor Patient experience, feedback in real time.   
  • Filter KPIs by departments and hospitals.   
  • Share role-based dashboards with management.  

Why Bold BI Is the Right Fit for Patient Experience Analytics

  • Connect patient experience data easily: Integrates survey data, operational metrics, and hospital systems.
  • Centralize experience monitoring: Combines satisfaction scores, visit time, and wait time in one view.
  • Support department-level analysis: Enables comparison of patient experience across hospital departments.
  • Enable focused insights: Designed to support operational reviews and quality improvement initiatives.
  • Secure healthcare analytics: Protect sensitive data with enterprise-grade security, including RLS, SSO, and RBAC.
  • Flexible deployment: Deploy dashboards securely in the cloud or self-hosted environments to meet healthcare needs.

Compare Options (at a glance)

Feature Bold BI Patient Experience Dashboard Manual Surveys Spreadsheets
Department-wise satisfaction tracking  Yes Limited Manual
Visit & wait time analysis  Yes Limited Manual
Demographic filtering  Yes Limited Manual
Trend analysis over time  Yes Limited Manual
Executive-ready dashboards  Yes Limited No

Frequently Asked Questions

Yes. Patient ratings are clearly grouped by hospital department.
Yes. Average visit length is included to assess care efficiency.
Yes. Filters allow focused analysis by time period and department.
Yes. Patient experience can be reviewed by gender.
Hospital administrators, quality teams, and department leaders.
Yes. The dashboard shows how long patients wait to see providers.

Compare Options (at a glance)

Feature Bold BI Patient Experience Dashboard Manual Surveys Spreadsheets
Department-wise satisfaction tracking  Yes Limited Manual
Visit & wait time analysis  Yes Limited Manual
Demographic filtering  Yes Limited Manual
Trend analysis over time  Yes Limited Manual
Executive-ready dashboards  Yes Limited No

Simple Pricing That Grows With You

Say goodbye to hidden costs, complex quotes, and pricing guesswork. 

Trusted by Users. Recognized by Experts.

Don't take our word for it

Here are a few kind words from some of our happy customers.

Software Advice

Frequently Asked Questions

Yes. Patient ratings are clearly grouped by hospital department.
Yes. Average visit length is included to assess care efficiency.
Yes. Filters allow focused analysis by time period and department.
Yes. Patient experience can be reviewed by gender.
Hospital administrators, quality teams, and department leaders.
Yes. The dashboard shows how long patients wait to see providers.

Start your 30-day free trial instantly

Easy integration, AI-Powered Dashboards and 24x5 real-time support.