Orthopaedic Clinical Variation Dashboard
Identify variations in clinical practices to improve care consistency and patient outcomes.
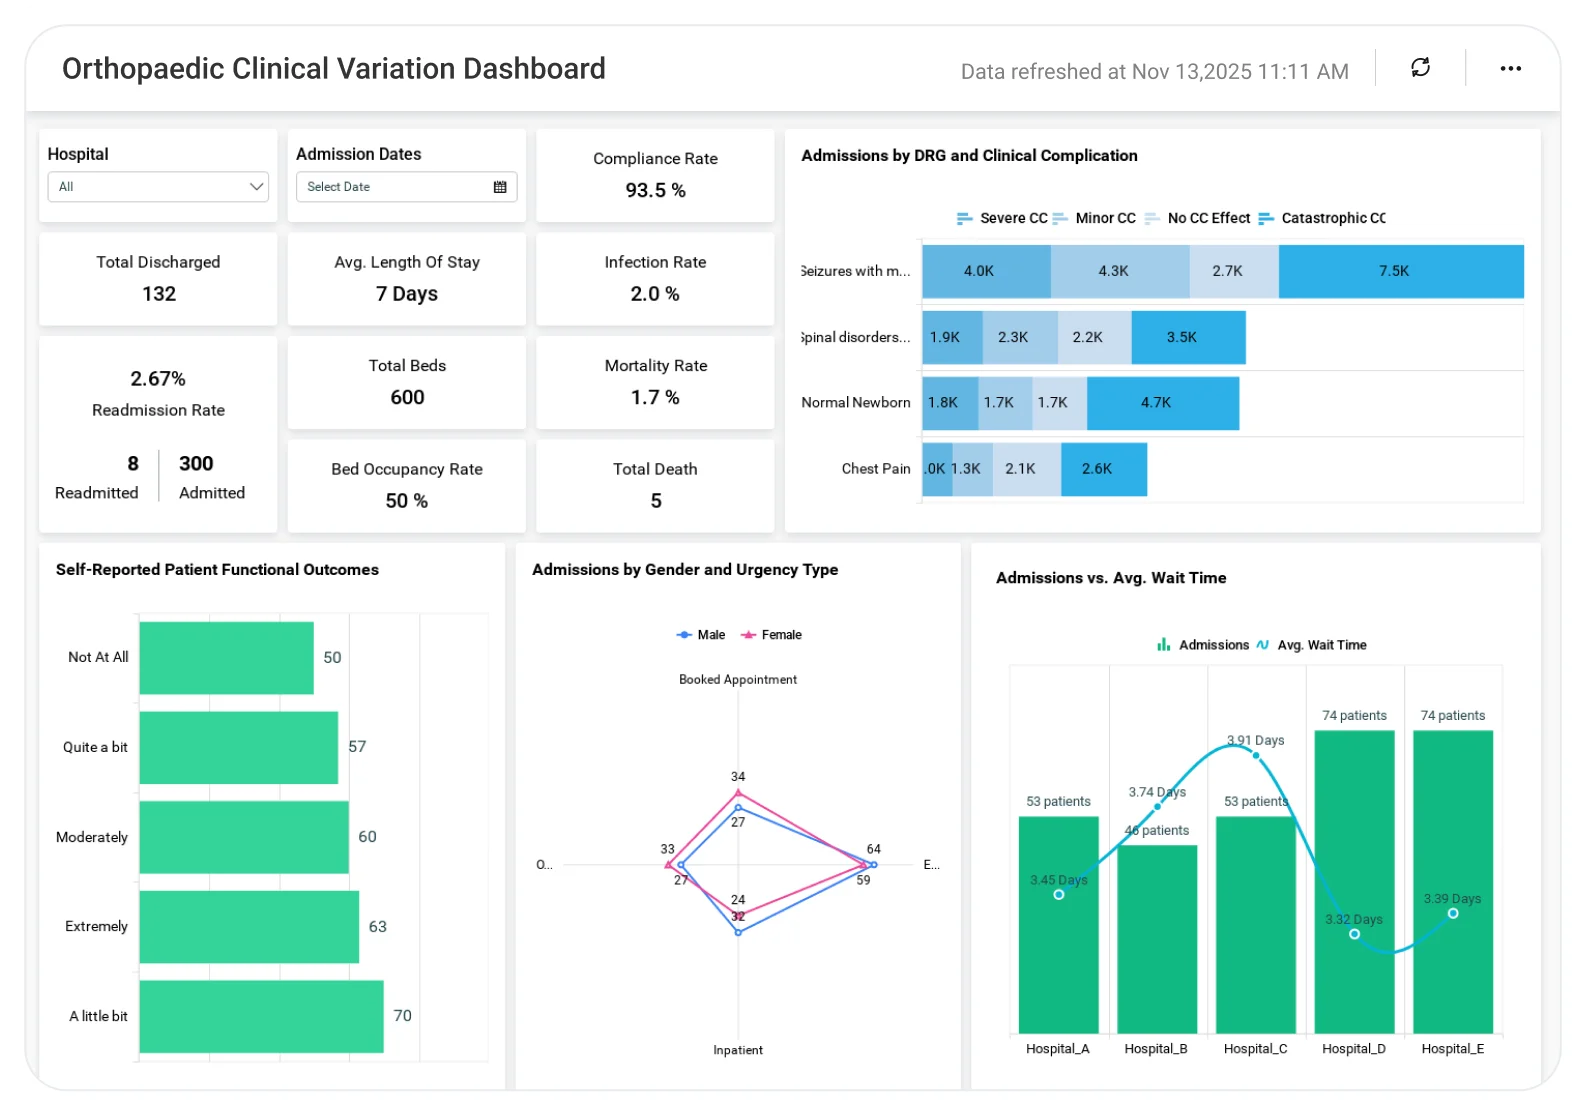
The Clinical Variation Dashboard helps healthcare leaders analyze treatment patterns, outcome differences, and practice variations across providers, enabling standardization of care, reduced unwarranted variation, and improved clinical quality.
TL;DR
-
Clinical Performance Tracking: Admissions, readmissions, and occupancy rates at a glance.
-
Cost Management: Break down medical expenses by DRG and patient type.
-
Outcome Monitoring: Case complexity, bed-day savings and mortality rates.
-
Patient Insights: Demographics, urgency levels, and complication severity.
-
Data Filtering: Drill down by date, facility, DRG, or urgency level.
What Is an Orthopaedic Clinical Variation Dashboard?
An orthopaedic clinical variation dashboard is a tool for tracking performance indicators related to patient outcomes and resource utilization.
With Bold BI, you can combine real-time hospital data with advanced visual analytics to spot trends, manage costs, and raise the standard of care.
Why an Orthopaedic Clinical Variation Dashboard Matters
This dashboard gives you a complete picture of the KPIs that matter most for orthopaedic care. You’ll be able to answer questions like:
-
How many beds are occupied, and what is the average length of stay?
-
How are admissions and readmissions distributed by month and DRG?
-
How many episodes do patients experience?
-
How does the patient population vary by urgency type?
-
How do medical costs break down by DRG?
What You'll Track
-
Primary KPIs: Occupied beds, average length of stay, discharges, deaths, mortality rate, and potential bed-day savings.
-
Complexity Analysis: The Average Complexity card shows the percentage of complex cases.
-
Cost & Admission Insights: Average medical cost by DRG and admission vs. readmission trends.
-
Urgency Breakdown: Patient distribution by urgency type to flag high-priority cases.
-
Episode & Complication Trends: Visualize patient episodes by month, gender, and complication severity.
-
Patient Demographics Summary: Demographics by gender and patient type for better planning.
-
Focused analysis with filters: Drill down by date, facility, DRG, complication type, or urgency to analyze specific patient groups, time periods, cost drivers, or complication frequency.
These insights help clinical teams identify improvement areas, benchmark performance, and deliver consistent, high-quality care.
How It Works
-
Connect: Connect EHR systems, billing databases, and hospital software.
-
Apply Sample: Select the Orthopaedic Clinical Variation Dashboard.
-
Blend: Combine patient, cost, and outcome data into a unified view.
-
Act: Identifying trends, enjoy better care pathways, and cut down on unnecessary variation.
-
Share: Role-based dashboards for clinicians, administration, and analysts.
Why Bold BI Is the Right Fit for Clinical Variation & Orthopaedic Analytics
-
Unified clinical view: Combine EHR, billing, and patient data in one dashboard for complete care visibility.
-
Variation & outcome tracking: Benchmark DRG, urgency, length of stay, costs, and outcomes to reduce unwarranted variation.
-
Proactive insights: Use trends to anticipate admissions, readmission risks, and resource needs.
-
Operational efficiency: Improve bed utilization, patient throughput, and length of stay.
-
Better care decisions: Monitor readmissions and mortality to drive targeted quality improvements.
-
Customizable metrics: Configure KPIs to match clinical workflows and quality initiatives.
Compare Options (at a glance)
| Feature | Bold BI | EHR/Quality Program Standard Reports | Spreadsheets |
|---|---|---|---|
| Procedure volume & case-mix trends (by surgeon, facility, DRG/CPT) | Yes | Limited | Manual |
| Clinical variation analysis (LOS, implant choice, pathway adherence) | Yes | Partial | Manual |
| Outcomes & complications tracking (readmissions, infections, revisions) | Yes | Limited | Manual |
| Cost of care & utilization (OR time, imaging, PT, supplies, implants) | Yes | Partial | Manual |
| Quality measures & benchmarking (PROMs, VTE prophylaxis, SSI rates) | Yes | Limited | Manual |
| Surgeon/facility comparisons with drilldowns (peer groups, cohorts) | Yes | Limited | Manual |
| Custom KPIs, role-based access, governance & embedded dashboards | Fully customizable | Fixed | Manual |
Frequently Asked Questions
More Articles About Orthopaedic Clinical Variation Dashboard
-
Unlocking the Power of Healthcare Analytics
 Discusses healthcare analytics trends and how dashboards like Orthopaedic Clinical Variation optimize patient outcomes and operational efficiency.
-
Boost Clinical Outcomes with Embedded Analytics
Explains how embedding the Orthopaedic Clinical Variation Dashboard helps track metrics like patient wait time, safety, urgency, and complications, improving care quality and departmental performance.