Clinical Trials Dashboard
Understand clinical trial progress and outcomes to improve research efficiency and decision-making.
The Clinical Trials Dashboard helps research and healthcare teams analyze enrollment trends, trial phases, timelines, and study performance, enabling better planning, reduced risks, and more successful clinical trial execution.
TL;DR
-
Total number of global clinical trials and sponsors.
-
Enrollment totals and averages by phase and sponsor.
-
Trial distribution by country, phase, and status.
-
Forecasted trial trends by year.
-
Top conditions and phases driving trial activity.
What Is a Clinical Trials Dashboard?
A Clinical Trials Dashboard is a visual analytics tool that tracks global clinical trial activity, enrollment, phases, and outcomes.
In Bold BI, this includes interactive charts, maps, and tables that help researchers explore trial data by geography, condition, intervention, and time, all updated automatically.
Why a Clinical Trials Dashboard Matters
Clinical trial data is vast, global, and constantly evolving.
Without a centralized analytics view:
-
Trial activity is hard to compare across regions.
-
Enrollment trends are difficult to analyze.
-
Research focus areas lack data-backed prioritization.
-
Forecasting future trial activity becomes guesswork.
What You’ll Track
Using Bold BI dashboards, you will track important project overview KPIs such as:
-
Global trial volume & enrollment: Monitor total trials, sponsors, sources, and participant enrollment worldwide.
-
Trial breakdowns by type & phase: Analyze studies by phase, sponsor type, study type, intervention type, and status.
-
Geographic & time-based trends: View trials by country and analyze historical and forecasted trial counts by year.
-
Top conditions & phases: Identify the top five conditions globally and understand how trials are distributed across phases.
All dashboards are fully customizable, allowing you to add KPIs or metrics as needed.
How It Works
-
Apply the Clinical Trials Dashboard sample.
-
Explore data using maps, charts, and detailed grids.
-
Filter trials by start year, completion year, or intervention type.
-
Share role-based dashboards with researchers, analysts, and leadership.
Why Bold BI Is the Right Fit for Clinical Analytics
Bold BI is designed to analyze large, multi-dimensional healthcare datasets efficiently.
With Bold BI, you can:
-
Analyze clinical trials worldwide from a single dashboard.
-
Break down trials by phase, type, intervention, and status.
-
Track enrollment metrics across sponsors and funding types.
-
Forecast future trial activity based on historical trends.
-
Deploy dashboards in cloud or self-hosted environments.
Compare Options (at a glance)
| Feature | Bold BI | Static Reports | Spreadsheets |
| Global trial visibility | Yes | Limited | Manual |
| Enrollment analytics | Yes | Partial | Manual |
| Forecasting | Yes | No | No |
| Interactive filtering | Yes | No | Manual |
| Deployment | Cloud / self-hosted | SaaS only | Local |
Frequently Asked Questions
More Articles About Clinical Trials
-
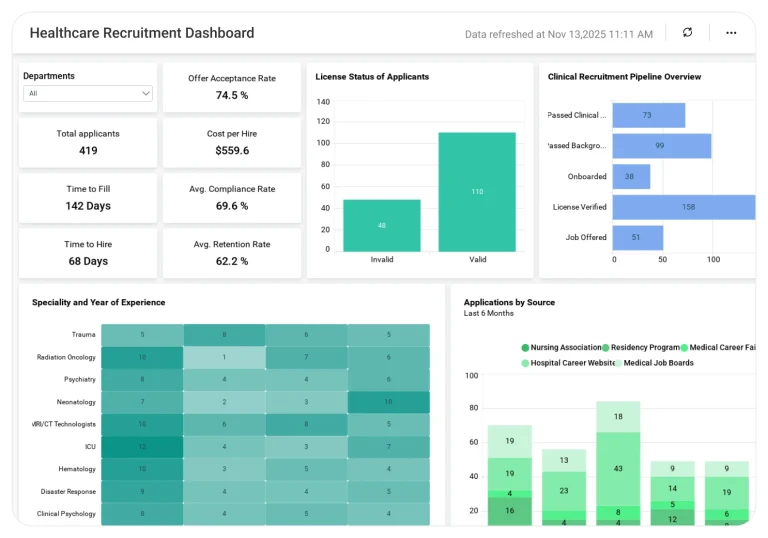
What is Healthcare Analytics? Benefits & Real-Time Use Cases
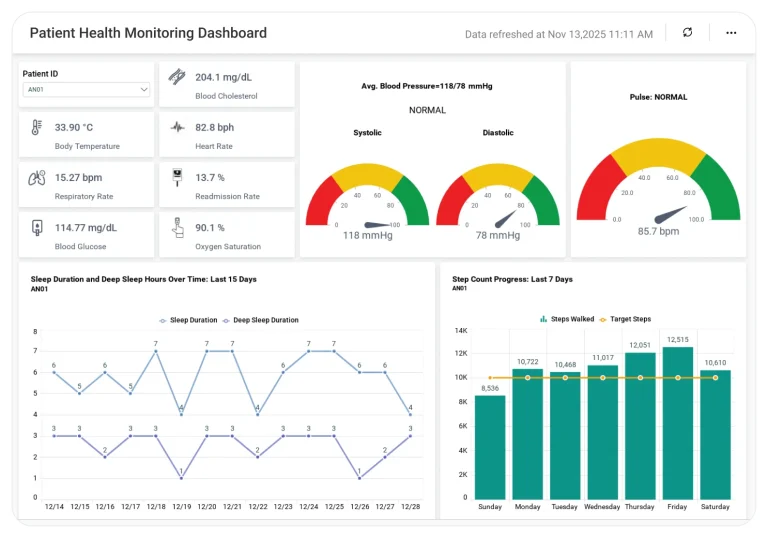
This blog explains the concept of healthcare analytics and how it transforms patient care and research. Learn about its benefits, including improved decision-making, operational efficiency, and real-time use cases that showcase how analytics drives better outcomes in healthcare organizations.
-
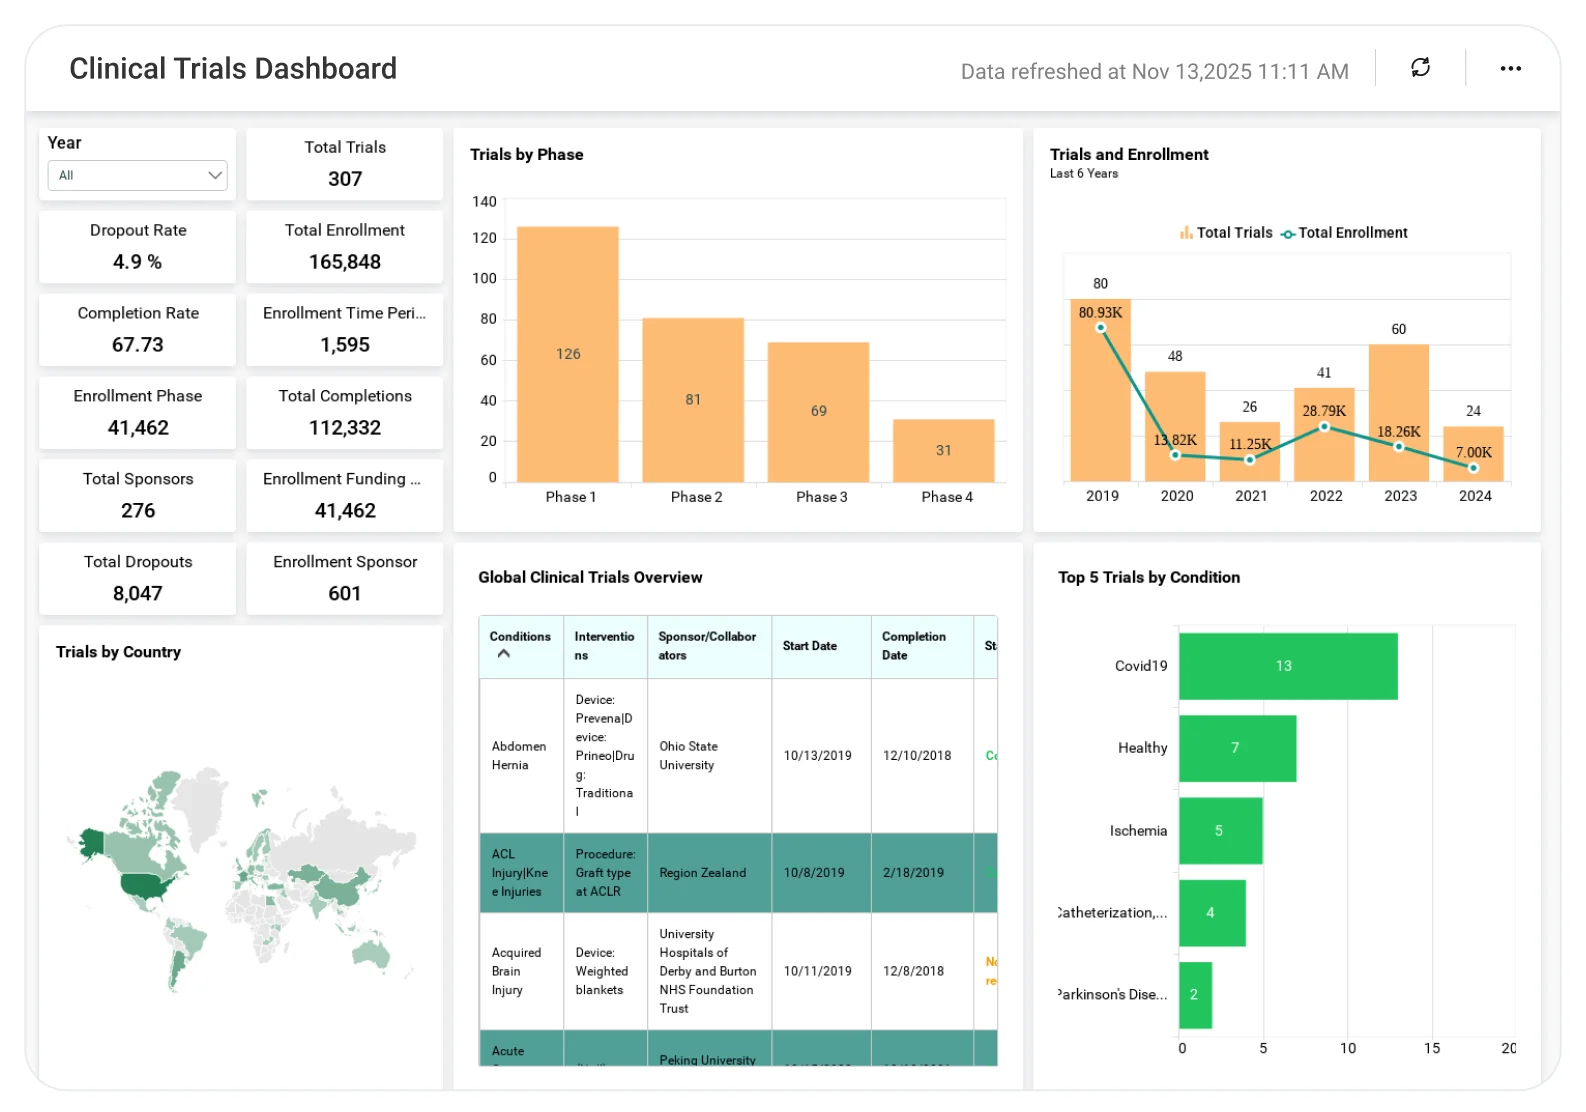
How to Create a Clinical Trial Dashboard in Bold BI
This video guides you through building a clinical trial dashboard in Bold BI. It covers setting up widgets such as KPI cards, charts, and maps to visualize trial phases, enrollment trends, and geographic distribution. Learn how to configure filters and customize dashboards for research teams.
