Radiology Rejection Analysis Dashboard
Track radiology rejection rates, root causes, and turnaround impact to reduce repeat imaging and improve diagnostic throughput.
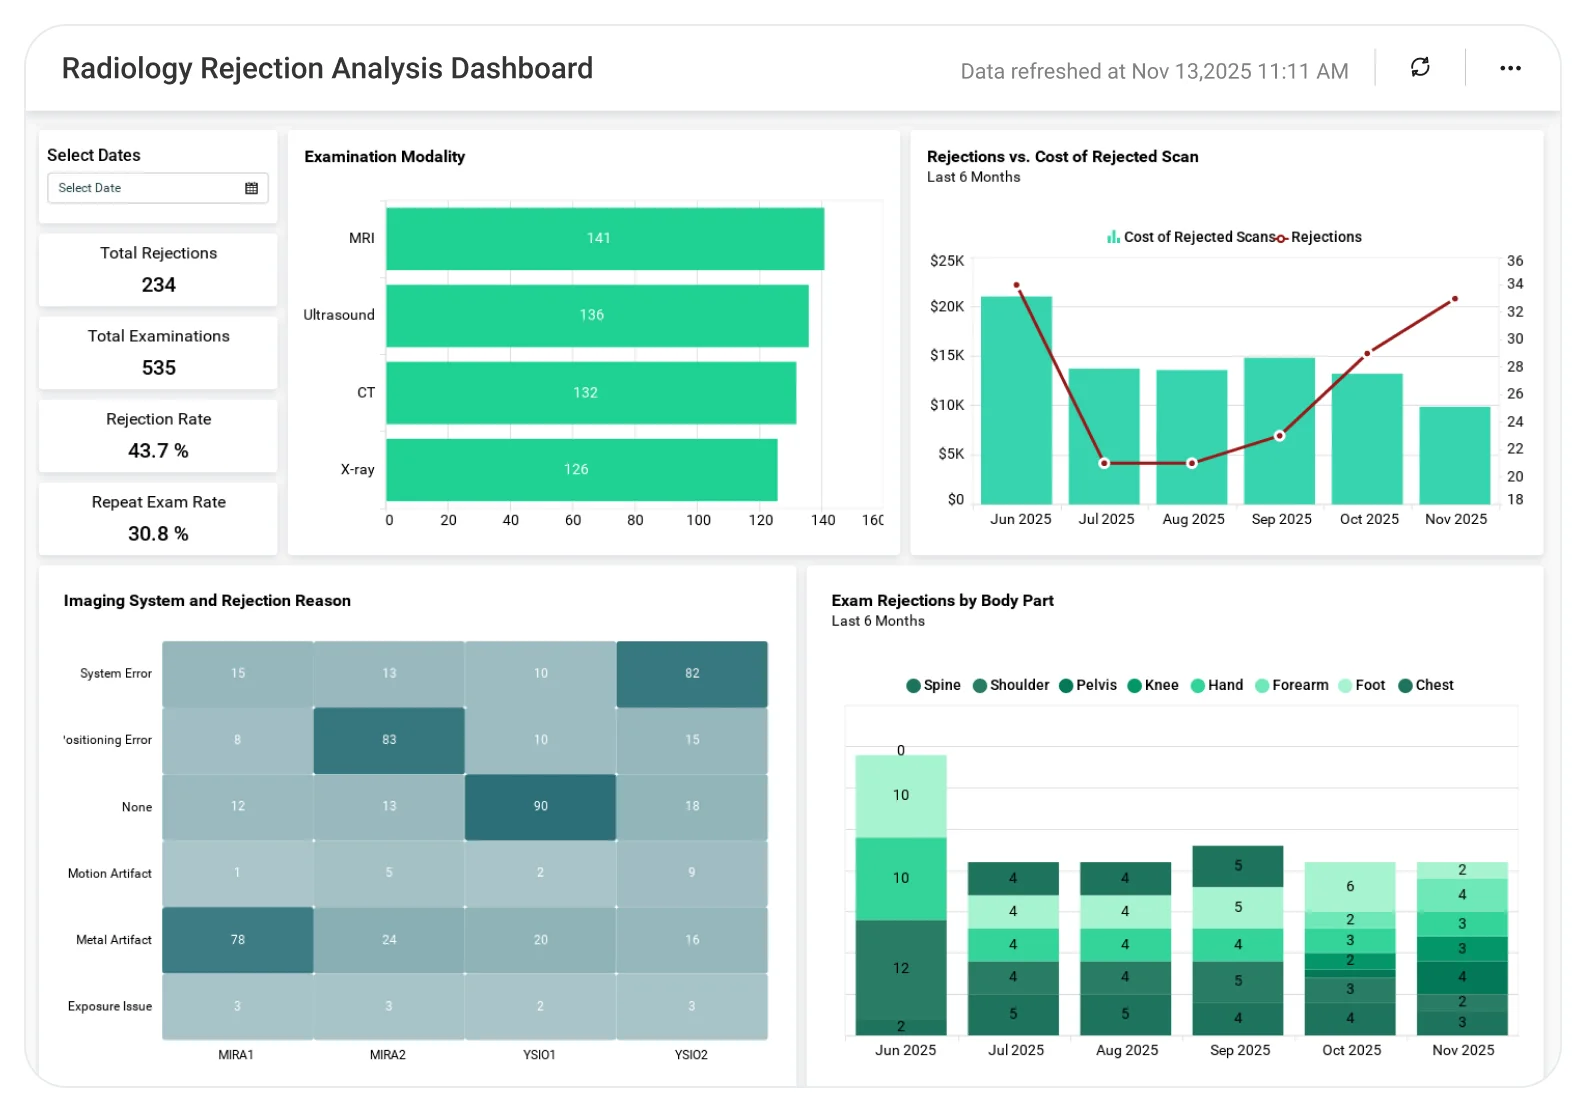
The Radiology Rejection Analysis Dashboard helps hospital networks and diagnostic organizations track rejected imaging studies, rejection reasons, and turnaround impact in one centralized view, supporting image quality improvement and workflow optimization across facilities.
TL;DR
-
Track radiology rejection volume and trend patterns to spot rising repeat imaging early.
-
Analyze rejection reasons by modality, exam type, and site to target quality improvements.
-
Measure the impact of rejections on turnaround time (TAT) to protect diagnostic SLAs.
-
Compare rejection performance across facilities, service lines, and modalities to identify risk areas.
-
Reduce repeat scans and operational waste with data-driven radiology quality insights.
What Is a Radiology Rejection Analysis Dashboard?
A Radiology Rejection Analysis Dashboard is an analytics solution that provides visibility into imaging studies that are rejected due to quality, protocol, or technical issues, highlighting where and why rework occurs.
With Bold BI, data from RIS/PACS metadata, EHR/EMR, scheduling systems, and data warehouses is unified into interactive dashboards, helping healthcare organizations move from anecdotal rejection reviews to systematic, data‑backed quality improvement.
Why a Radiology Rejection Analysis Dashboard Matters
Rejected radiology exams increase costs, delay diagnoses, and impact patient experience.
When rejection data is fragmented:
-
Repeat imaging rates rise unnoticed.
-
Turnaround times extend unexpectedly.
-
Staff retraining needs are hard to pinpoint.
-
Quality and accreditation reporting becomes manual.
A centralized rejection analysis dashboard enables healthcare organizations to move from reactive quality audits to proactive radiology performance optimization.
What You’ll Track
Using Bold BI dashboards, you will track important KPIs such as:
-
Rejection volume & trends: Number of rejected studies over time to identify rising patterns.
-
Rejection reasons: Breakdown by quality issues, protocol errors, or technical failures to target improvements.
-
Modality-wise rejection rates: CT, MRI, X-ray, or ultrasound rejection analysis to identify modality-specific risks.
-
Operational impact indicators: Effect of rejections on turnaround time and workload by facility or service line.
All dashboards are fully customizable, allowing you to add KPIs or metrics as needed.
How It Works
-
Apply the Radiology Rejection Analysis Dashboard sample.
-
Combine imaging, rejection, and operational data into a unified analytics model.
-
Analyze insights by facility, modality, exam type, or time period.
-
Share dashboards with radiology leadership, operations, and quality teams.
Why Bold BI Is the Right Fit for Radiology Rejection Analytics
Bold BI is designed to analyze large, multi-dimensional healthcare datasets efficiently.
With Bold BI, you can:
-
Pinpoints root causes of repeat imaging and rework: Identifies recurring rejection reasons so teams can address training, protocols, or equipment issues.
-
Improves diagnostic turnaround and patient flow: Reduces delays caused by rejected studies, helping radiology departments maintain throughput targets.
-
Aligns radiology, clinical, and operations teams: Provides a shared view of quality and efficiency metrics across departments.
-
Supports accreditation and quality improvement initiatives: Offers consistent, drillable metrics needed for audits and quality reviews.
-
Scales across multi-site hospital and imaging networks: Designed for large IDNs and diagnostic networks with multiple modalities and locations.
Compare Options (at a glance)
| Feature | Bold BI | RIS / PACS Reports | Spreadsheets |
| Radiology rejection analytics | Yes | Limited | Manual |
| Rejection reason analysis | Yes | Partial | Manual |
| Modality & facility drilldowns | Yes | Limited | Manual |
| TAT impact visibility | Yes | Limited | Manual |
| Custom KPIs & dashboards | Fully customizable | Fixed | Manual |