Oil and Gas Downstream Dashboard
Understand downstream operations to improve efficiency and business performance.
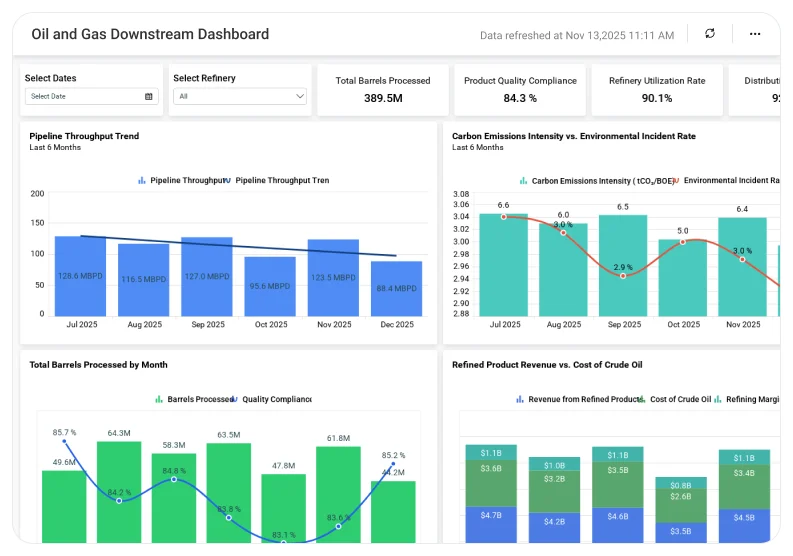
The Oil and Gas Downstream Dashboard helps teams analyze refining, distribution, sales, and operational data, making it easier to manage operations, reduce costs, and improve overall performance.
TL;DR
-
Track refinery production and throughput trends to monitor downstream operational efficiency.
-
Monitor inventory levels across terminals and storage locations to prevent shortages or overstocking.
-
Analyze product-wise sales and distribution performance to understand demand fulfillment.
-
Evaluate margin contribution by product and region to protect profitability.
-
Support faster commercial and operational decisions with data-driven downstream performance insights.
What Is an Oil and Gas Downstream Dashboard?
An Oil and Gas Downstream Dashboard is an analytics solution that provides visibility into refining, storage, distribution, and sales activities across the downstream value chain.
With Bold BI, downstream data from refinery systems, inventory platforms, logistics tools, and commercial systems is unified into interactive dashboards, helping organizations move from siloed operational views to end-to-end downstream performance analysis.
Why Oil and Gas Downstream Dashboard Matters
Downstream operations directly impact profitability, supply reliability, and market responsiveness.
When downstream data is spread across multiple systems:
-
Inventory imbalances go unnoticed.
-
Refinery output and sales planning fall out of sync.
-
Margin erosion is detected too late.
-
Decisions rely on delayed or partial data.
A centralized downstream dashboard enables organizations to move from reactive operations to proactive margin and supply optimization.
What You’ll Track
Using Bold BI dashboards, you will track important KPIs such as:
-
Refinery production & throughput: Output volumes by refinery and unit to assess operational efficiency.
-
Inventory & stock movement: Product inventory levels across terminals and storage to prevent shortages or excess.
-
Sales & distribution performance: Product sales volume and movement across regions to understand demand fulfillment.
-
Margin & product contribution: Revenue and margin by product type to identify high- and low-performing outputs.
All dashboards are fully customizable, allowing you to add KPIs or metrics as needed.
How It Works
-
Apply the Oil and Gas Downstream Dashboard sample.
-
Combine production, inventory, distribution, and sales data into a unified model.
-
Analyze insights by refinery, product, region, or time period.
-
Share dashboards with operations, supply chains, and commercial teams.
Why Bold BI Is the Right Fit for Downstream Performance Analytics
-
Aligns refining output with market demand: Helps teams understand whether refinery production matches sales demand and distribution capacity.
-
Improves inventory and supply chain coordination: Highlights stock imbalances across terminals, enabling better replenishment and transfer decisions.
-
Protects margins through early visibility: Surfaces product-level margin trends so corrective actions can be taken before profitability erodes.
-
Supports faster commercial and operational decisions: Provides a single, trusted view used by downstream operations, supply, and sales leaders.
-
Scales across complex downstream networks: Designed for organizations operating multiple refineries, terminals, and distribution regions.
Compare Options (at a glance)
| Feature | Bold BI | Operational Reports | Spreadsheets |
| Downstream performance analytics | Yes | Limited | Manual |
| Inventory & supply visibility | Yes | Partial | Manual |
| Product-wise margin analysis | Yes | Limited | Manual |
| Cross-location comparison | Yes | Limited | Manual |
| Custom KPIs & drilldowns | Fully customizable | Fixed | Manual |