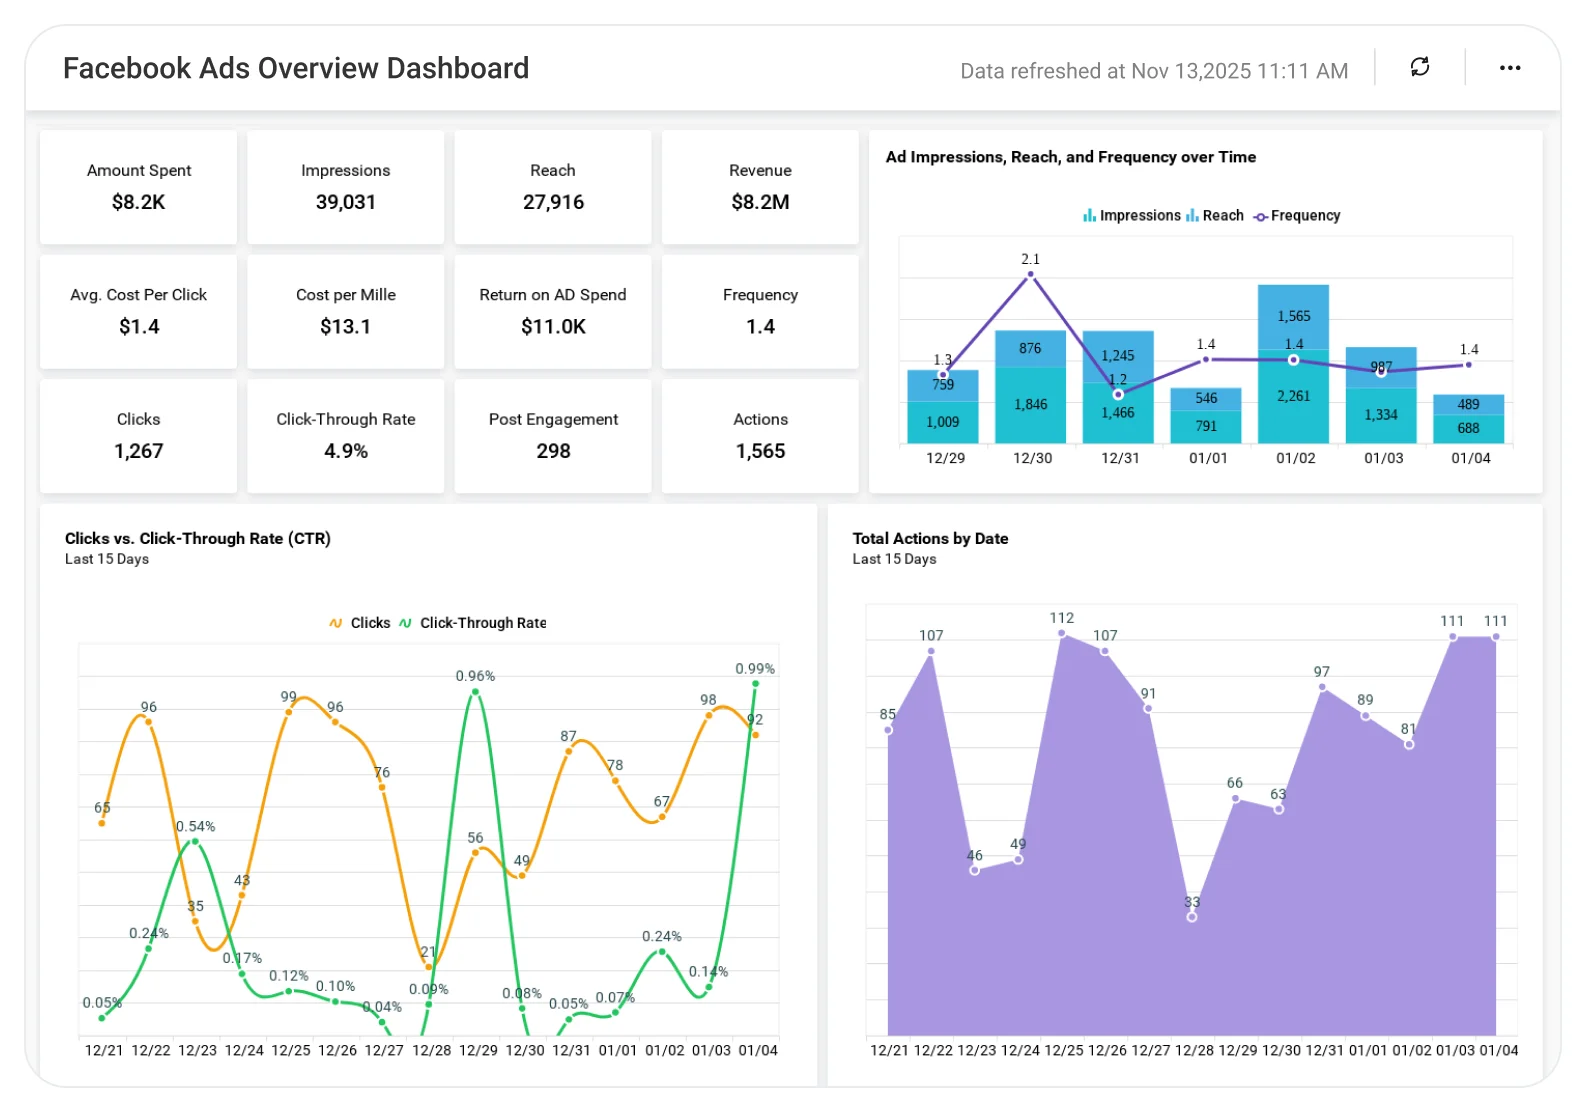
Facebook Ads Overview Dashboard
Improve ad performance by understanding spend efficiency, reach, and conversion outcomes.
The Facebook Ads Dashboard helps marketing teams analyze campaign spend, impressions, clicks, and conversions, enabling better budget allocation, higher ROI, and data-driven campaign optimization.
TL;DR
-
Clicks, CTR, and cost per click across campaigns.
-
Return on ad spend (ROAS) and overall cost efficiency.
-
Engagement and reach trends over time.
-
Campaign-level performance visibility.
-
Understand what drives results and what needs improvement.
What Is a Facebook Ads Overview Dashboard?
A Facebook Ads Overview Dashboard is a visual analytics tool that tracks advertising performance, engagement, reach, and cost metrics across campaigns.
In Bold BI, it becomes an interactive dashboard that allows marketers to monitor KPIs, evaluate ROI, and optimize ad spend without switching between multiple reports.
Why Facebook Ads Dashboard Matters
Facebook advertising generates massive volumes of data, but turning that data into insight is often time-consuming.
Without a centralized dashboard:
-
ROI is harder to track consistently.
-
High-performing campaigns are difficult to identify.
-
Optimization decisions rely on guesswork..
Bold BI simplifies Facebook ad analytics by presenting all key metrics in one place, helping teams focus on performance improvement instead of manual analysis.
What You’ll Track
-
Ad performance metrics: Monitor clicks, click-through rate (CTR), and cost per click (CPC) to evaluate campaign effectiveness.
-
Cost & ROI analysis: Track ad spend efficiency and return on ad spend (ROAS) to understand profitability.
-
Engagement & reach trends: Analyze how users interact with ads and how campaigns reach changes over time.
-
Campaign-level insights: Compare performance across campaigns to identify top-performing and underperforming ads.
All dashboards are fully customizable, allowing you to add KPIs or metrics as needed.
How It Works
-
Connect Facebook Ads data.
-
Apply the Facebook Ads Overview dashboard sample.
-
Monitor campaign performance in real time.
-
Share insights with marketing and leadership teams.
-
Embed dashboards into internal marketing platforms.
Why Bold BI Is the Right Fit for Facebook Ads Analytics
-
One dashboard for ads, engagement, and ROI metrics.
-
Clear visibility into cost-effectiveness and performance.
-
Easy-to-understand visuals for quick optimization.
-
Secure access with Single Sign On, Role Based Access Control and Row Level Security.
-
Flexibility in deployment.
Compare Options (at a glance)
| Feature | Bold BI Facebook Ads Overview Dashboard | Facebook Ads Manager Reports | Spreadsheets |
| Campaign performance tracking (spend, reach, clicks) | Yes | Yes | Manual |
| Conversion & ROI analysis | Yes | Limited | Manual |
| Audience & demographic insights | Yes | Limited | Manual |
| Cross-campaign & time-based trend analysis | Yes | Limited | Manual |
| Executive-ready dashboards | Yes | Limited | No |
Frequently Asked Questions
More Articles About Facebook Ads & Marketing Analytics
-
Optimizing Facebook Advertising with Business Intelligence Strategies
 Explains how business intelligence helps marketers analyze Facebook ad performance, improve ROI, and make smarter campaign optimization decisions.
-
3 Must-Have Social Media Analytics Dashboard Examples
Shows how dashboards help track engagement, reach, clicks, and performance across social media platforms, including paid advertising campaigns.