Steps Tracking Dashboard
Improve athlete activity consistency, support training load decisions, and strengthen fitness programs with step-based performance insights.
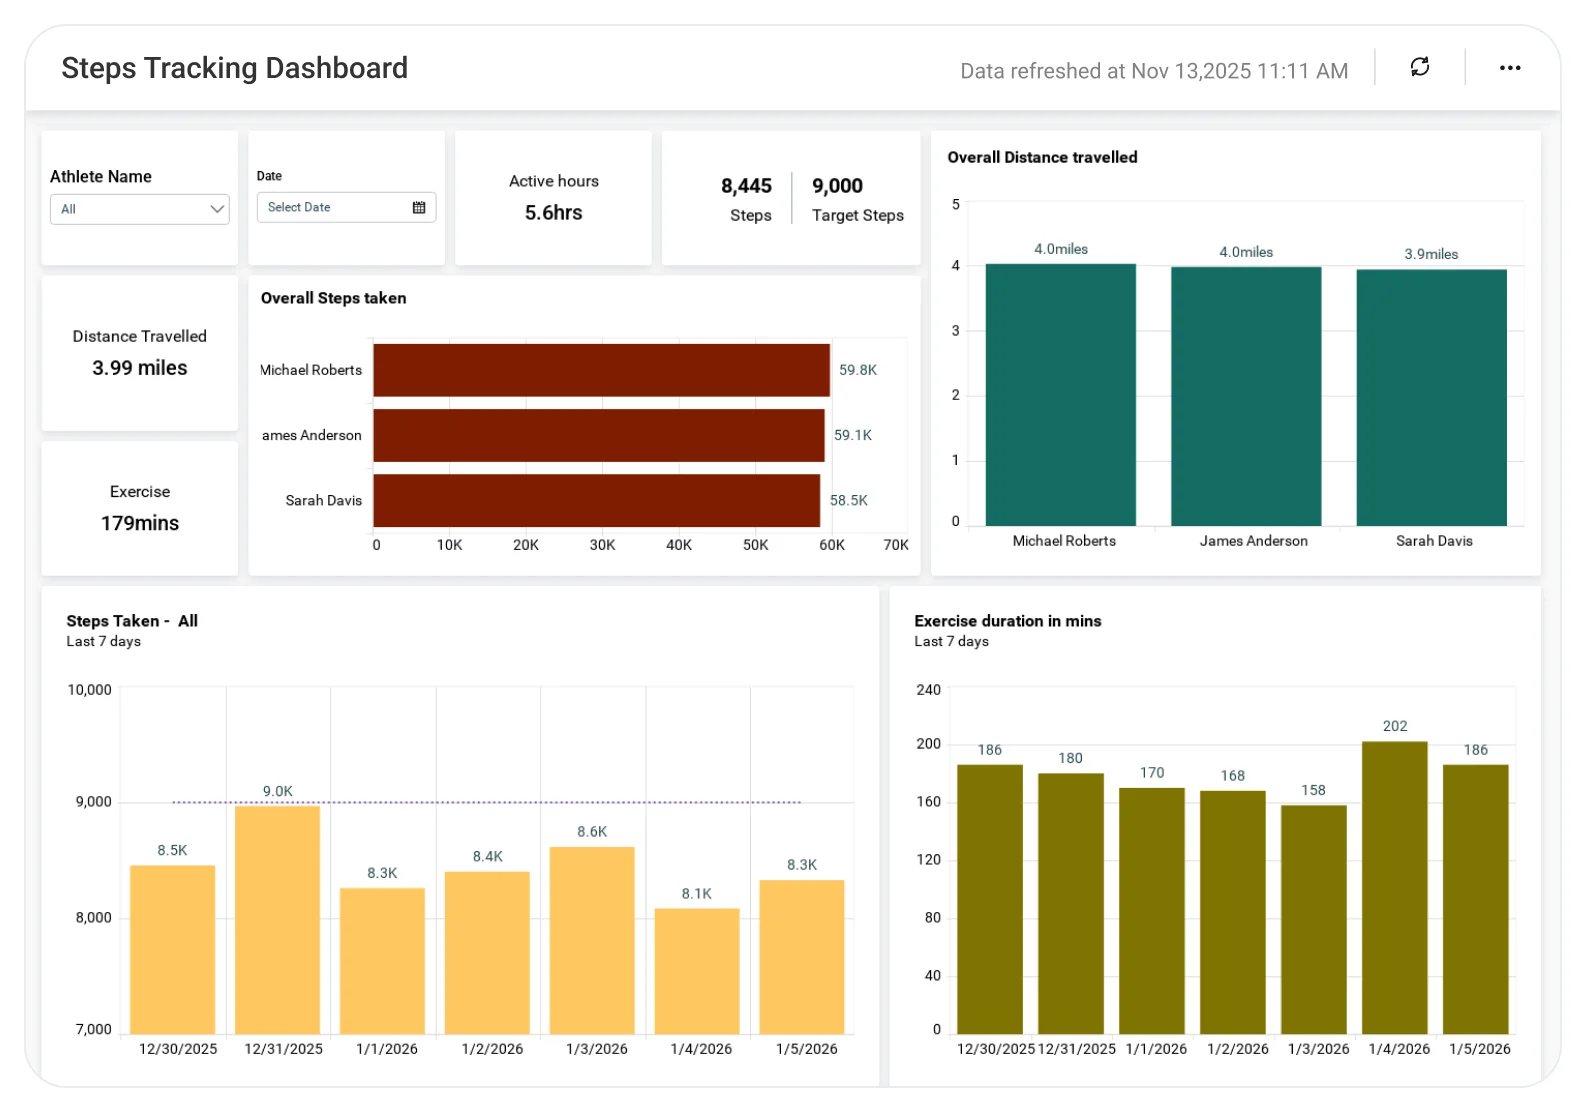
The Steps Tracking Dashboard helps sports teams and performance staff understand daily movement patterns and workload distribution across athletes. This supports smarter conditioning strategies and more effective recovery planning.
TL;DR
-
Track daily and cumulative step count trends to understand overall activity volume.
-
Compare activity distribution across athletes, teams, or groups to spot workload imbalances.
-
Monitor step consistency and workload patterns to support conditioning and recovery planning.
-
Analyze activity by session, day, week, or event to evaluate training and match demands
-
Support smarter fitness and performance decisions with data-driven step and movement insights.
What Is a Steps Tracking Dashboard?
A Steps Tracking Dashboard is an analytics view that consolidates step and activity data from wearables, fitness systems, or tracking platforms into a structured performance overview.
With Bold BI, step data is transformed into interactive dashboards that help teams evaluate movement volume, compare activity levels, and align step-based metrics with broader training and performance objectives.
Why Steps Tracking Dashboard Matters
Step data offers a simple but powerful indicator of movement volume and workload.
When step data is reviewed in isolation or manually:
-
Activity inconsistencies go unnoticed.
-
Training loads are difficult to contextualize.
-
Recovery planning lacks objective signals.
-
Long-term fitness trends are hard to assess.
A centralized steps dashboard helps teams turn raw step counts into actionable performance insights.
What You’ll Track
Using Bold BI dashboards, you will track important KPIs such as:
-
Daily & cumulative step counts: Understand movement volume across days, weeks, or training cycles.
-
Athlete & group activity distribution: Compare step levels across individuals, teams, or roles.
-
Workload consistency patterns: Identify fluctuations in activity that may impact conditioning or recovery.
-
Period & event-based comparisons: Evaluate step trends across training sessions, fixtures, or events.
All dashboards are fully customizable, allowing you to add KPIs or metrics as needed.
How It Works
-
Use the Steps Tracking Dashboard sample or create custom views.
-
Combine step data with athlete, session, or event context.
-
Analyze trends by individual, group, or time period.
-
Share dashboards with performance, coaching, and operations teams.
Why Bold BI Is the Right Fit for Steps Tracking Analytics
-
Transforms simple step data into performance context: Moves beyond raw counts to structured activity insights.
-
Supports training load and conditioning decisions: Helps teams balance movement volume across training cycles.
-
Aligns fitness, coaching, and performance teams: Provides a shared activity view across departments.
-
Reduces manual activity reporting: Eliminates spreadsheet-based step summaries.
-
Scales across teams, events, and venues: Suitable for clubs, leagues, and large-scale sports programs.
Compare Options (at a glance)
| Feature | Bold BI | Fitness Apps | Spreadsheets |
| Structured step analytics | Yes | Limited | Manual |
| Athlete & group comparisons | Yes | Partial | Manual |
| Trend & workload analysis | Yes | Limited | Manual |
| Shareable dashboards | Yes | Limited | No |
| Custom KPIs & views | Fully customizable | Fixed | Manual |