
Incident Management Dashboard for Support Managers
Understand incident trends to reduce impact and improve response effectiveness.
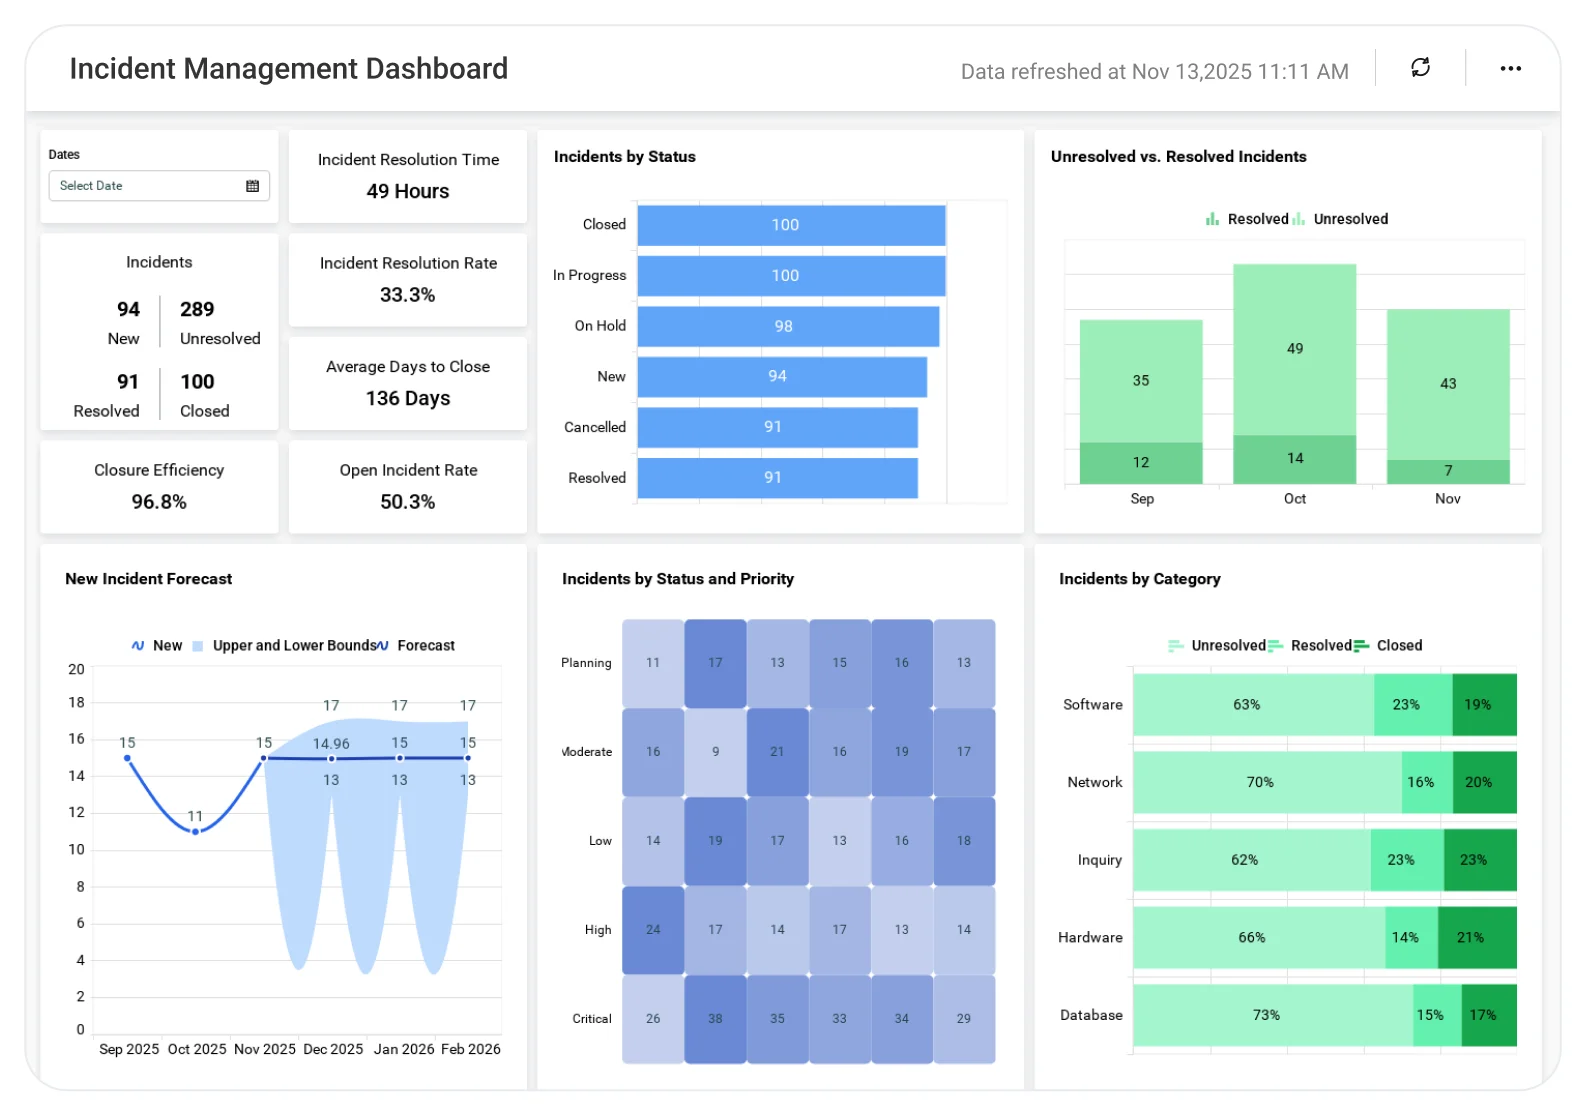
The Incident Management Dashboard helps teams analyze incident volume, severity, resolution time, and root causes, enabling faster response, better prioritization, and improved service reliability.
TL;DR
-
Incident volume clarity: Track new, closed, and resolved incidents for the current and previous month.
-
SLA & efficiency metrics: Track resolution time, backlog aging, and unresolved incident trends.
-
Daily operational pulse: Compare new vs. resolved vs. unresolved incidents each day.
-
Prioritization insight: Incidents organized by status and priority levels.
-
Root-cause indicators: Category-level breakdown to spot recurring issues.
-
Trend visibility: Six-month view of created vs. closed incidents for long-term patterns.
What Is an Incident Management Dashboard?
An incident management dashboard provides leaders with a real-time view of incident volume, workload distribution, SLA performance, and operational bottlenecks. In Bold BI, this refers to engaging visual representations that allow the teams to rank the incidents properly, fix issues quicker, and improve customer satisfaction.
Why Incident Management Dashboard Matters
Incidents disrupt services, impact customer trust, and create operational risk when they aren’t identified and resolved quickly. Without clear visibility into incident volume, severity, and resolution progress, teams struggle to prioritize issues and prevent repeat failures.
Effective incident management helps teams:
-
Detect and respond to critical incidents faster.
-
Prioritize issues based on severity and business impact.
-
Reduce downtime and service disruptions.
-
Identify recurring incidents and address root causes.
-
Improve collaboration between support, engineering, and operations teams.
By turning incident data into actionable insights, organizations can move from reactive firefighting to proactive service reliability.
What You’ll Track
-
Incident Volume & Workload: Monitor new, closed, and unresolved incidents, including daily trends and priority heatmaps.
-
New Incidents: Track monthly new incidents and compare current vs. previous periods.
-
Resolution Progress: See closed, resolved, and unresolved incidents to understand overall workload.
-
Priority Distribution: View status heatmaps by Critical, High, Medium, and Low priority.
-
SLA & Efficiency Metrics: Measure average resolution time, backlog size and aging, SLA compliance, and MTTR.
-
Root Cause & Categorization: Track new incidents by category, recurring issues, and the distribution of incident types (service requests, failures, access issues, etc.).
-
Long-Term Trends: Review six-month created vs. closed incidents, recurring spikes, and team performance trends.
All dashboards are fully customizable, allowing you to add KPIs like SLA breaches, CSAT impact, technician performance, or automation rate to fit your needs.
How It Works
-
Connect Service Now, Zendesk, SQL databases, Freshdesk, or Excel.
-
Apply the Incident Management sample with pre-built KPIs.
-
Blend support data with customer or engineering metrics for deeper insights.
-
Share dashboards with managers, agents, and executives.
-
Set alerts for spikes, SLA breaches, or aging tickets.
Why Bold BI Is the Right Fit for Incident Management Analytics
-
Unified support intelligence: Bring support, operations, and customer experience metrics into one dashboard.
-
Cross-Functional Visibility: Blend ticket data with customer satisfaction, engineering, and usage metrics for a complete view.
-
Self-Service Analytics for Every Role: Enjoy self-service analytics with governance for support leads, ops managers, and executives.
-
Deep Incident Drilldowns: Drill down from overall support load to individual incident details with ease.
-
Flexible Deployment & Embedding: Deploy in the cloud or on-premises and embed dashboards into your portals or support tools.
Compare Options (at a glance)
| Feature | Bold BI | ITSM Tool Reports | Spreadsheets |
|---|---|---|---|
| Incident volume & trend analysis | Yes | Limited | Manual |
| SLA compliance (response/resolution) tracking | Yes | Partial | Manual |
| MTTA/MTTR and resolution time breakdowns | Yes | Limited | Manual |
| Backlog aging & overdue incident visibility | Yes | Partial | Manual |
| Priority, category & assignment group drilldowns | Yes | Limited | Manual |
| Root cause & repeat-incident insights | Yes | Limited | Manual |
| Custom KPIs & dashboards | Fully customizable | Fixed | Manual |
Frequently Asked Questions
More Articles About Incident Management Dashboard
-
Build a ServiceNow Incident Monitoring Dashboard in a Minute
 A step-by-step guide to creating an incident management dashboard using ServiceNow data. Covers templates, KPIs, and integration with ServiceNow APIs.


