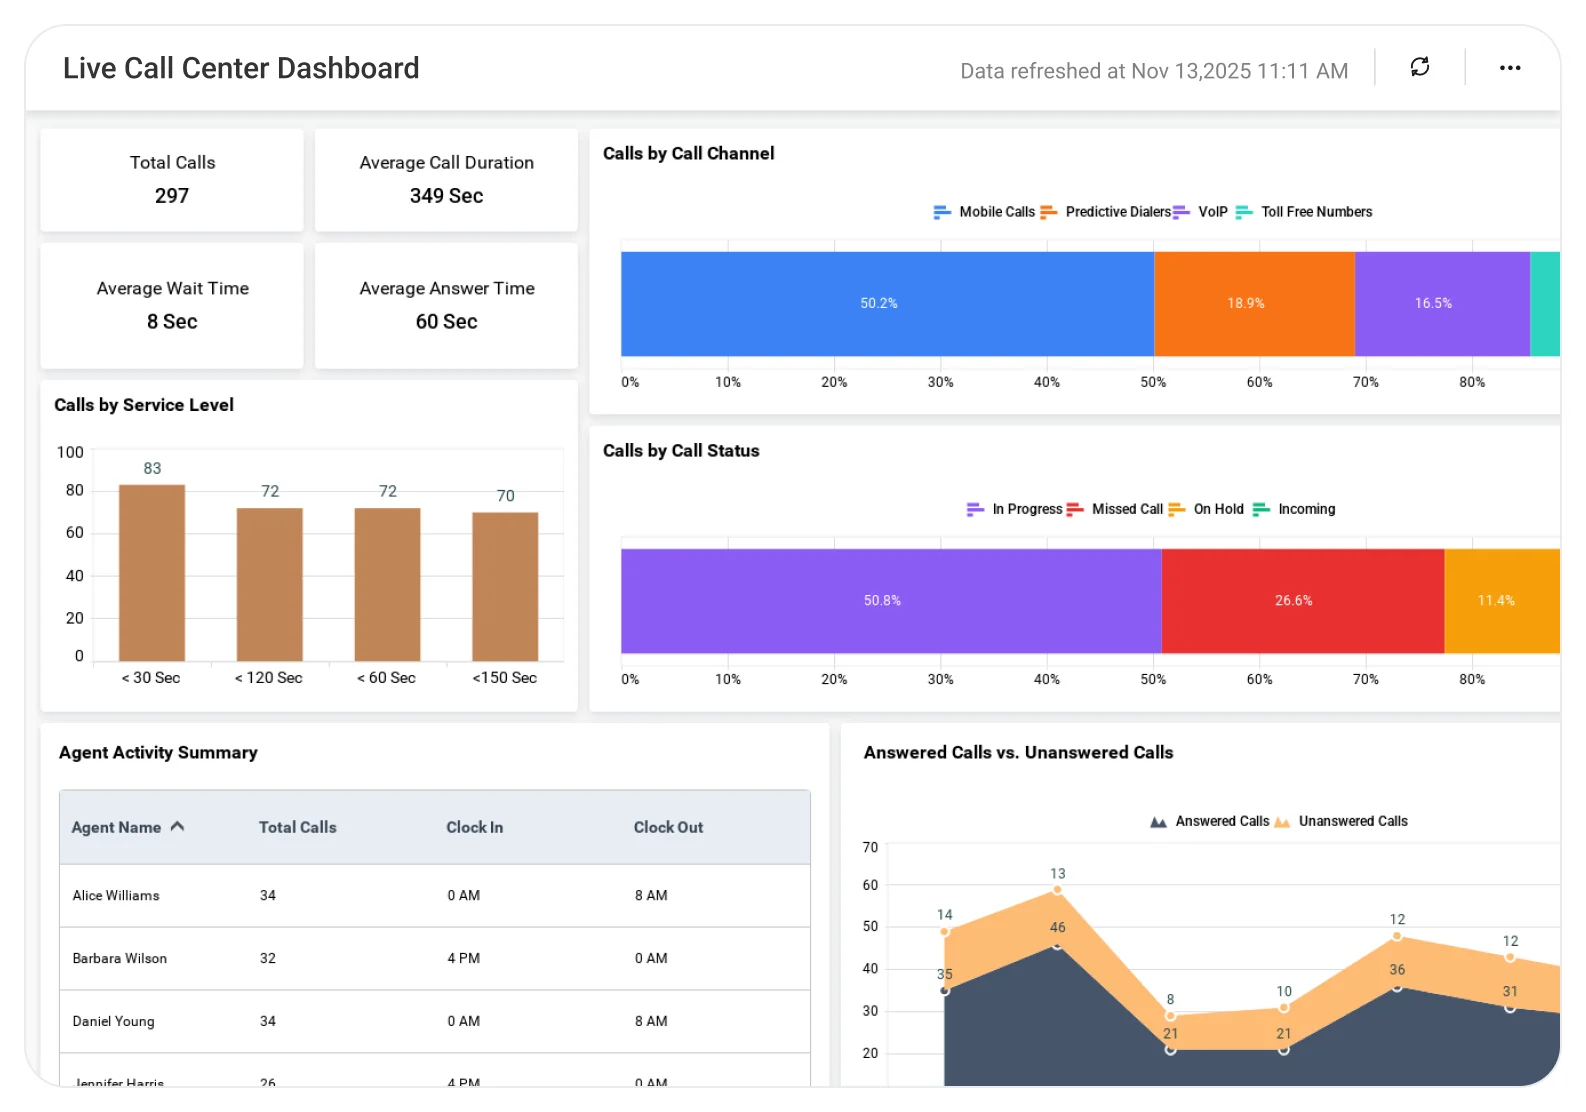
Live Call Center Dashboard
Understand live call center activity to improve response efficiency and customer experience.
The Live Call Centre Dashboard helps support teams analyze call volume, wait times, agent availability, and call handling performance, enabling better staffing decisions, faster responses, and improved service quality.
TL;DR
-
Monitor live inbound and outbound call volumes to stay ahead of demand spikes.
-
Track real-time queue status and customer wait times to protect service levels.
-
View active, idle, and available agent counts to rebalance staffing instantly.
-
Identify ongoing calls and SLA risks in real time to prevent breaches before they occur.
-
Enable faster floor-level decisions that reduce wait times and maintain customer experience.
What Is a Live Call Center Dashboard?
A Live Call Center Dashboard is a real-time analytics view that shows the current state of call center operations, including calls in progress, queues building up, and agent availability, without waiting for end‑of‑day or hourly reports.
With Bold BI, live data from call center platforms and support systems is streamed into a single dashboard, giving supervisors and operations teams instant situational awareness to act in the moment.
Why Live Call Center Dashboard Matters
Call center performance can change minute by minute.
When teams rely only on historical or delayed reports:
-
Queue overloads escalate unnoticed.
-
SLA breaches happen before action is taken.
-
Agents sit idle in one queue while others overflow.
-
Customer wait times increase unnecessarily.
A live dashboard enables teams to move from reactive damage control to real-time operational control.
What You’ll Track
Using Bold BI dashboards, you will track important KPIs such as:
-
Live call volume & queue load: Calls waiting, in progress, and completed to understand real-time demand.
-
Agent availability & utilization: Active, idle, and logged-in agents to support quick rebalancing.
-
Current wait time & SLA status: Real-time wait times and SLA indicators to prevent breaches.
-
Call handling flow: Ongoing calls by queue or channel to monitor operational pressure points.
All samples are easy to tailor, allowing you to add your own KPIs or connect data from any department.
How It Works
-
Connect live data feeds from call center platforms and support systems using REST APIs to Bold BI.
-
Apply the Live Call Center Dashboard sample.
-
Stream real-time call, queue, and agent activity into dashboards.
-
Monitor insights by queue, channel, or team.
-
Display dashboards on wallboards or share with supervisors and managers.
Why Bold BI Is the Right Fit for Live Call Center Analytics
-
Provides instant visibility into live operations: Shows exactly what’s happening across queues and agents without delay.
-
Helps prevent SLA breaches before they occur: Makes rising wait times and queue overload visible early so teams can act immediately.
-
Supports fast, informed floor-level decisions: Enables supervisors to reroute calls, rebalance agents, or escalate staffing in real time.
-
Improves coordination across teams and shifts: Keeps everyone aligned with the same live operational view during peak hours.
-
Scales for high-volume, multi-queue contact centers: Designed for environments where real-time responsiveness is critical.
Compare Options (at a glance)
| Feature | Bold BI | Call Center Live Views | Spreadsheets |
| Real-time call & queue visibility | Yes | Partial | No |
| Live agent availability tracking | Yes | Limited | No |
| SLA risk monitoring | Yes | Limited | No |
| Wallboard-ready dashboards | Yes | Limited | No |
| Custom KPIs & layouts | Fully customizable | Fixed | No |