BoldDesk Ticket Analytics Dashboard
Understand support ticket trends to improve resolution efficiency and customer satisfaction.
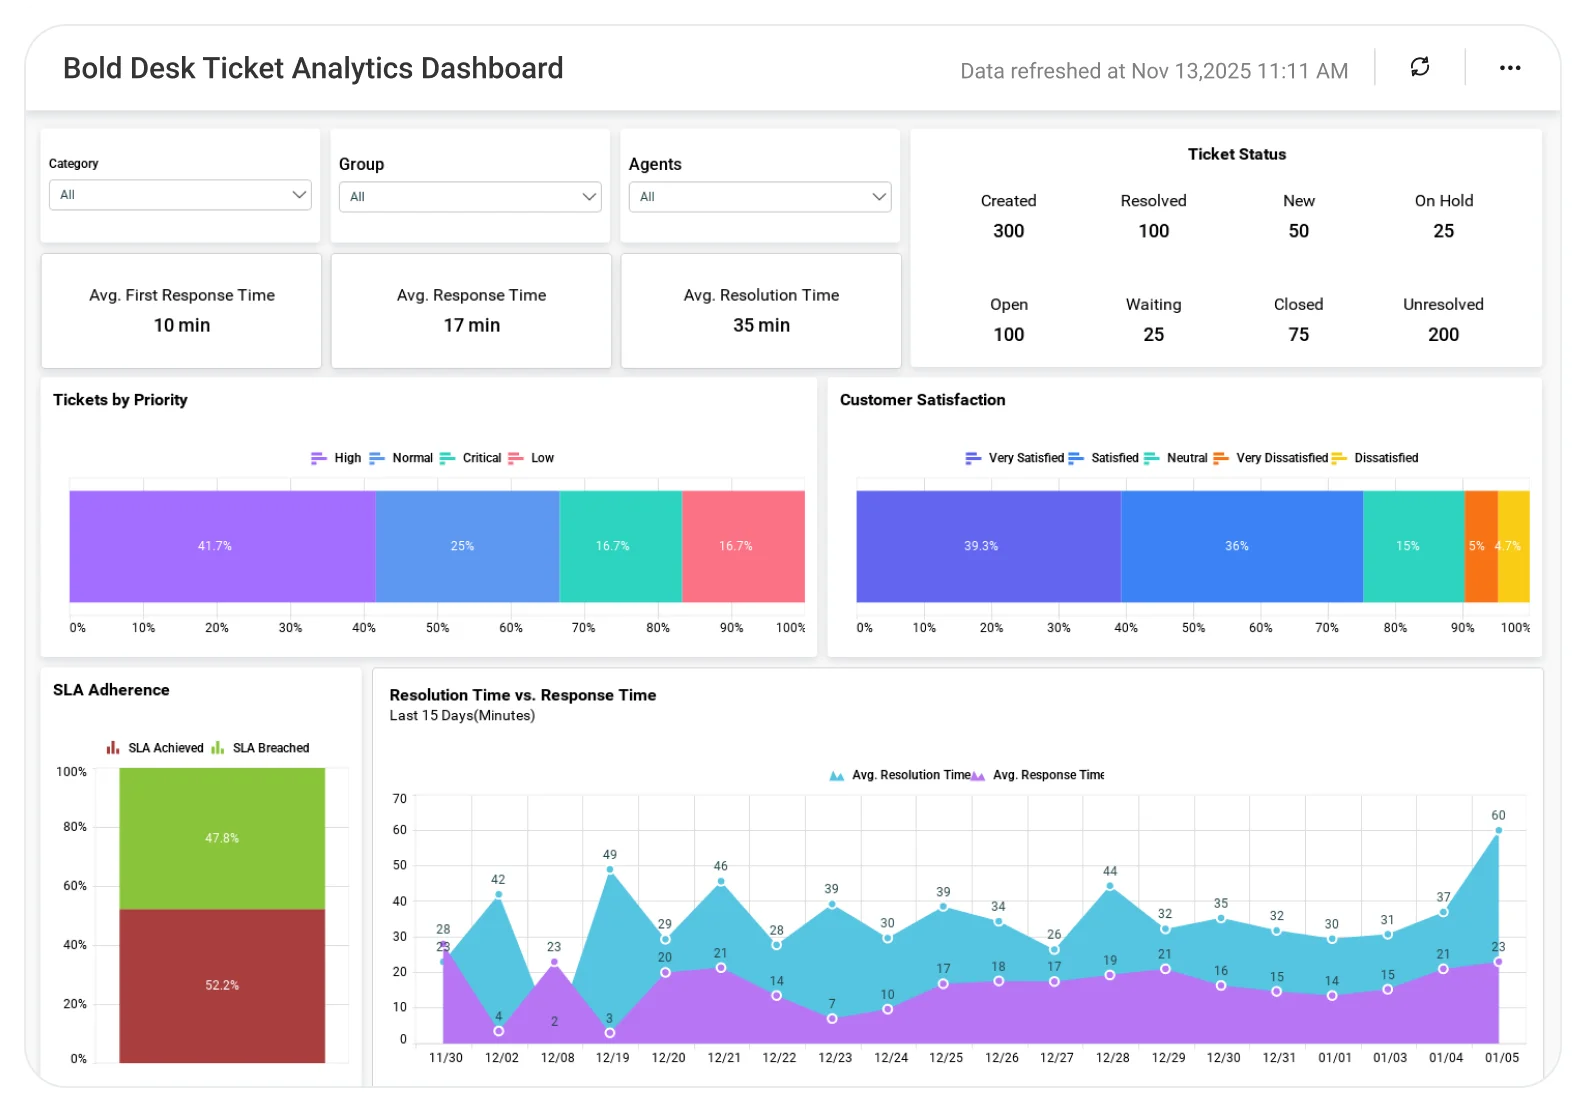
The BoldDesk Ticket Analytics Dashboard helps teams analyze ticket volume, response times, resolution rates, and agent performance, enabling better workload management, faster issue resolution, and improved support quality.
TL;DR
-
Incoming and resolved ticket volume trends.
-
First response time and handling efficiency.
-
Agent-level performance visibility.
-
Customer ratings and satisfaction patterns.
-
Clear signals on where support operations need improvement.
What Is a BoldDesk Ticket Analytics Dashboard ?
A ticket analytics dashboard is a visual analytics tool that tracks support workload, response efficiency, agent productivity, and customer satisfaction.
In Bold BI, it becomes an interactive dashboard that helps teams monitor support health in real time and optimize operations without manual reporting.
Why BoldDesk Ticket Analytics Dashboard Matters
As ticket volume grows, maintaining fast response times and consistent service quality becomes harder.
Without a centralized analytics view:
-
Performance gaps go unnoticed.
-
SLA risks surface too late.
-
Agent workload becomes unbalanced.
Bold BI transforms BoldDesk ticket data into actionable insights, enabling support teams to spot issues early, improve efficiency, and deliver better customer experiences.
What You’ll Track
-
Ticket volume trends: Monitor incoming, resolved, and pending tickets to understand support demand.
-
Response & handling efficiency: Track first response time and average handling time to evaluate service speed.
-
Agent performance metrics: Analyze agent productivity and workload distribution across the team.
-
Customer satisfaction insights: Measure customer ratings and satisfaction scores to assess service quality.
-
Secure and scalable: Share dashboards securely with marketing, sales, and leadership teams as programs grow.
All dashboards are fully customizable, allowing you to add KPIs or metrics as needed.
How It Works
Why Bold BI Is the Right Fit for BoldDesk Ticket Analytics
-
One dashboard for tickets, agents, and satisfaction metrics.
-
Real-time visibility into operational performance.
-
Clear visuals for faster decision-making.
-
Secure access with Single Sign On, Role Based Access Control and Row Level Security.
-
Cloud or self-hosted deployment flexibility.
Compare Options (at a glance)
| Feature | Bold BI | BoldDesk Native Reports | Spreadsheets |
| Real-time ticket volume & status tracking | Yes | Limited | Manual |
| Agent productivity & workload insights | Yes | Limited | Manual |
| SLA compliance & response time analysis | Yes | Partial | Manual |
| Category, priority & channel-wise analysis | Yes | Limited | Manual |
| Executive-ready dashboards | Yes | Limited | No |
Frequently Asked Questions
More Articles About BoldDesk Ticket Analytics Dashboard
-
The Power of BI in the Freshdesk Support Ticket System
 Explains how BI dashboards help analyze support ticket volume, response times, agent performance, and service trends to improve support operations.
-
Bold BI Embedded Analytics at Solutions Review Data Demo Day
Demonstrates how ticket data can be visualized to track SLAs, agent productivity, and customer satisfaction in a centralized dashboard