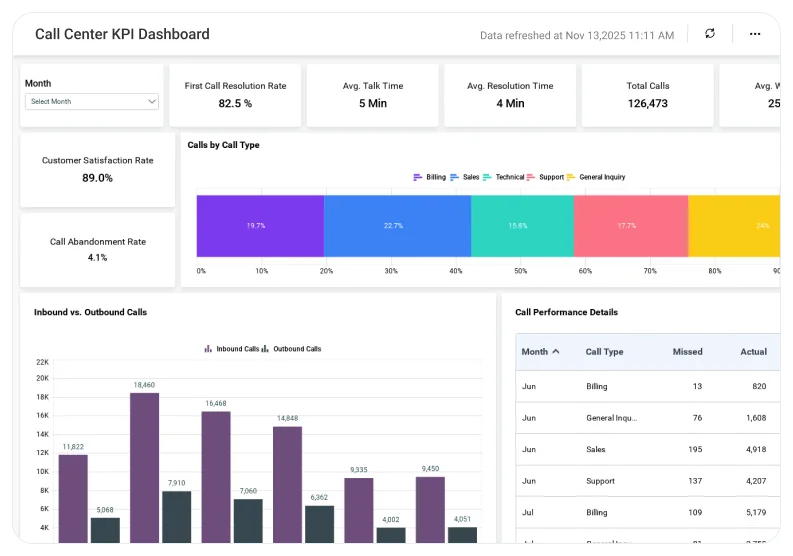
Call Center KPI Dashboard
Gain clear visibility into service performance, identify operational gaps early, and consistently meet customer experience targets with KPI‑driven insights.
The Call Center KPI Dashboard helps support leaders track key metrics, such as call volume, service levels, response times, and resolution quality, in one centralized view, enabling faster decisions and more consistent support performance.
TL;DR
-
Track inbound and outbound call volume trends to understand demand and traffic patterns.
-
Monitor service level, response time, and SLA performance to stay ahead of compliance risks.
-
Analyze call abandonment and wait-time patterns to reduce customer friction.
-
Evaluate resolution, escalation, and repeat-call indicators to measure support effectiveness.
-
Enable faster operational decisions and consistent service outcomes with KPI-driven call center insights.
What Is a Call Center KPI Dashboard?
A Call Center KPI Dashboard is an analytics solution that consolidates core performance indicators used to measure the health and effectiveness of support operations.
Bold BI transforms data from call center platforms, CRM, and support systems into clear dashboards that help teams monitor performance, trends, and SLA health in real time.
Why Call Center KPI Analytics Matters
Call centers operate on tight SLAs and high customer expectations.
When KPI tracking relies on disconnected reports:
-
SLA breaches are identified too late.
-
Performance trends remain unclear.
-
Operational issues repeat across shifts.
-
Leadership lacks a real-time performance snapshot.
A centralized KPI dashboard helps teams identify risks early and manage service performance before issues escalate.
What You’ll Track
Using Bold BI dashboards, you will track important KPIs such as:
-
Call volume & traffic patterns: Inbound and outbound calls over time to understand demand fluctuations.
-
Service level & response time: Average speed of answer and SLA compliance to measure responsiveness.
-
Abandonment & wait-time metrics: Dropped calls and queue wait times to identify customer friction points.
-
Resolution & escalation rates: First-call resolution and escalations to assess support effectiveness.
All samples are easy to tailor, and you can add your own KPIs or connect data from any department.
How It Works
-
Apply the Call Center KPI Dashboard sample.
-
Combine call activity, queue data, and outcome metrics into a unified model.
-
Analyze insights by queue, channel, team, or time period.
-
Share dashboards with support managers and leadership teams.
Why Bold BI Is the Right Fit for Call Center KPI Analytics
-
Single source of truth for KPIs: Brings all core KPIs into one dashboard instead of scattered reports.
-
Early detection of SLA risks: Makes service level drops and rising wait times visible early.
-
Data-driven operational decisions: Enables managers to adjust staffing, routing, and priorities based on real trends.
-
Consistency across shifts and teams: Standardized KPIs ensure everyone measures success the same way.
-
Scales with growing operations: Designed for high-volume contact centers with multiple queues and channels.
Compare Options (at a glance)
| Feature | Bold BI | Call Center Reports | Spreadsheets |
| Centralized KPI tracking | Yes | Limited | Manual |
| SLA & service level monitoring | Yes | Partial | Manual |
| Trend & pattern analysis | Yes | Limited | Manual |
| Queue & channel drilldowns | Yes | Limited | No |
| Custom KPIs & dashboards | Fully customizable | Fixed | Manual |