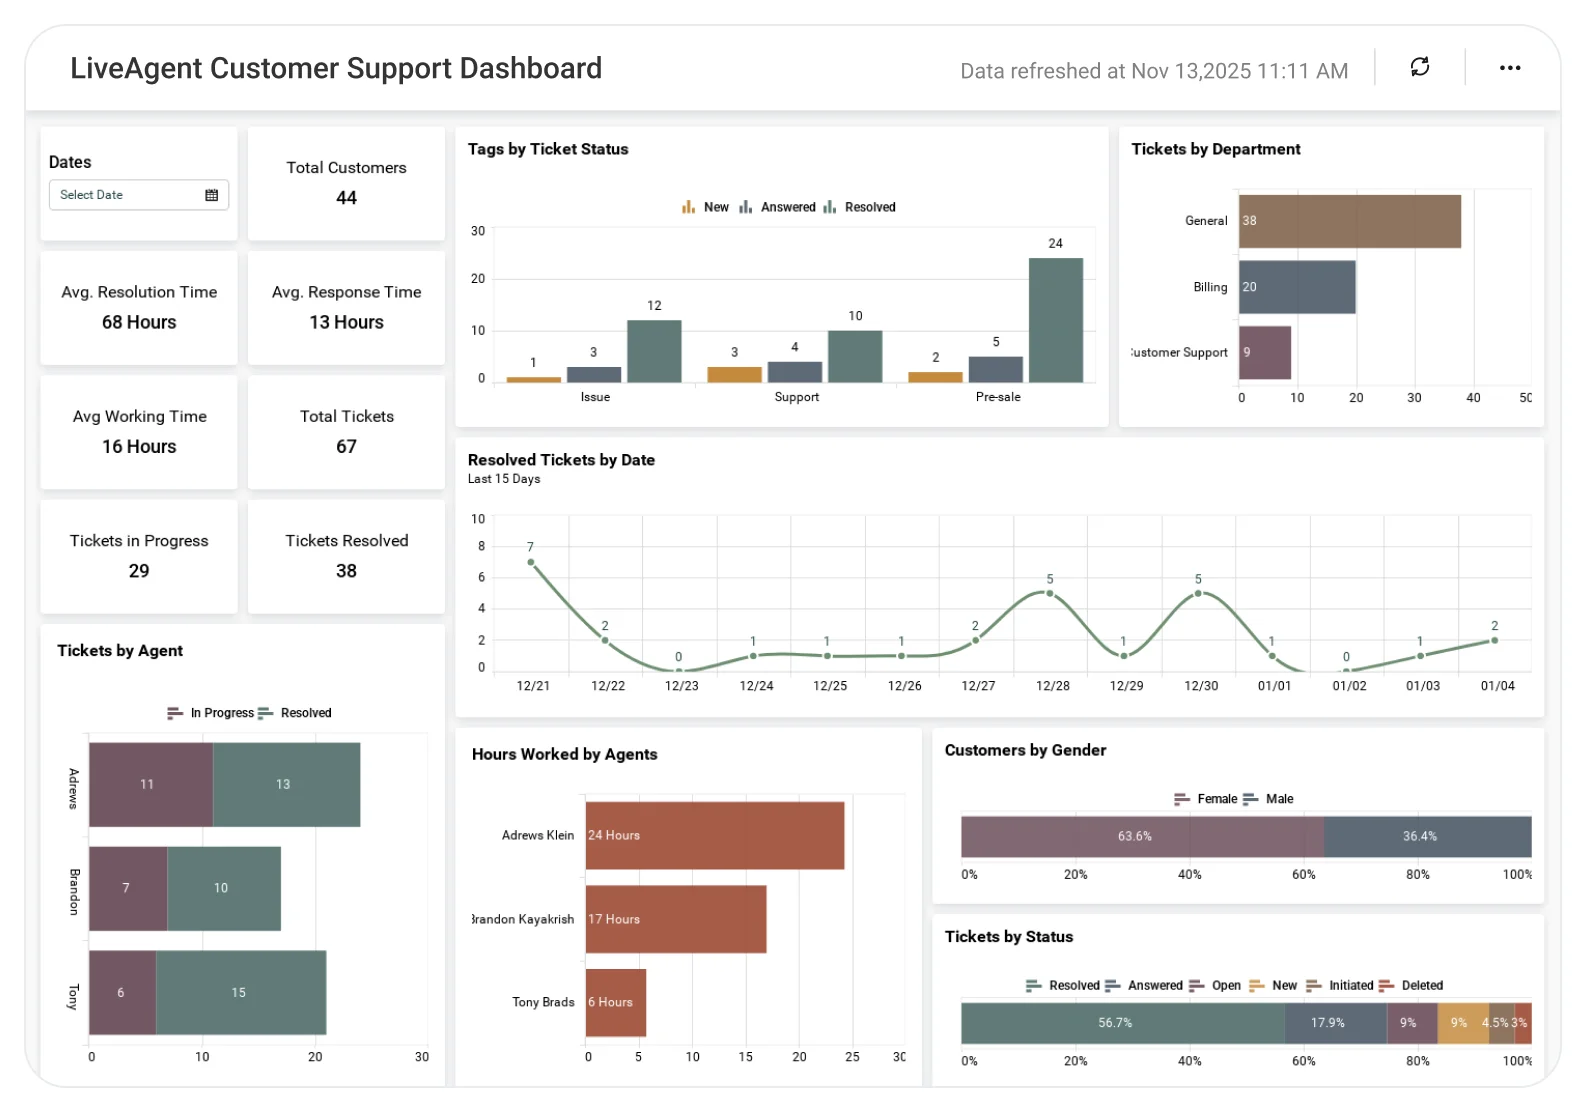
LiveAgent Customer Support Dashboard
Understand customer support performance to improve service quality and response efficiency.
The LiveAgent Customer Support Dashboard helps teams analyze ticket volume, response times, resolution rates, and agent performance, enabling faster issue resolution, better workload balance, and improved customer satisfaction.
TL;DR
-
Average first response and resolution times.
-
Ticket status distribution across the workflow.
-
Agent and department performance visibility.
-
Ticket volume trends over time.
-
Customer and channel-level support insights.
What Is a LiveAgent Customer Support Dashboard?
A customer support monitoring dashboard tracks ticket flow, response efficiency, agent performance, and customer behavior in one place.
In Bold BI, it becomes an interactive analytics layer that helps teams quickly understand support health and drill deeper when needed, without relying on static reports.
Why LiveAgent Support Dashboard Matters
Fast, consistent support depends on clear visibility in response times, workloads, and SLA performance.
Without a centralized dashboard:
-
Response delays go unnoticed.
-
Agent workloads become uneven.
-
Staffing needs are harder to forecast.
Bold BI centralizes LiveAgent metrics into one structured view, helping teams stay proactive, meet SLAs, and continuously improve support quality.
What You’ll Track
-
Response & resolution efficiency: Monitor average first response time and average resolution time to measure how quickly customer issues are addressed.
-
Ticket workflow status: Track how many tickets are in progress, waiting for customer input, or completed across selected time periods.
-
Agent & department performance: Analyze ticket handling and workload distribution by agent and department to identify strengths and gaps.
-
Customer & channel insights: Understand where tickets come from, including customer demographics and submission channels such as email, phone, or forums.
All dashboards are fully customizable, allowing you to add KPIs or metrics as needed.
How It Works
-
Connect LiveAgent support data.
-
Apply the LiveAgent Customer Support dashboard sample.
-
Monitor SLAs, ticket flow, and agent workloads in real time without manual reports.
-
Filter data by date or department for focused analysis.
-
Share dashboards with managers or embed them internally.
Why Bold BI Is the Right Fit for LiveAgent Customer Support Analytics
Bold BI is built to handle high-volume support tickets and real-time LiveAgent data without performance or visibility gaps.
With Bold BI, you can:
-
Monitor ticket volume, status, and SLA compliance in real time.
-
Track first response and resolution times across teams.
-
Analyze agent performance and workload distribution.
-
Break down tickets by channel, priority, customer, or department.
-
Deploy dashboards in cloud or self-hosted environments.
Compare Options (at a glance)
| Feature | Bold BI | LiveAgent Native Reports | Spreadsheets |
| Real-time ticket volume tracking | Yes | Limited | Manual |
| Agent performance & workload analysis | Yes | Limited | Manual |
| SLA compliance & response time insights | Yes | Limited | Manual |
| Channel-wise support analysis (chat, email, calls) | Yes | Partial | Manual |
| Executive-ready dashboards | Yes | Limited | No |
Frequently Asked Questions
More Articles About LiveAgent Customer Support Dashboard
-
Maximizing ROI with Effective Customer Analytics
 Customer support analytics enables businesses to understand customer behavior, improve experiences, and drive growth using data-driven insights, with Bold BI providing real-time dashboards and predictive analytics to support smarter decisions.