Energy Sustainability Dashboard
Understand energy usage and sustainability metrics to reduce environmental impact and improve efficiency.
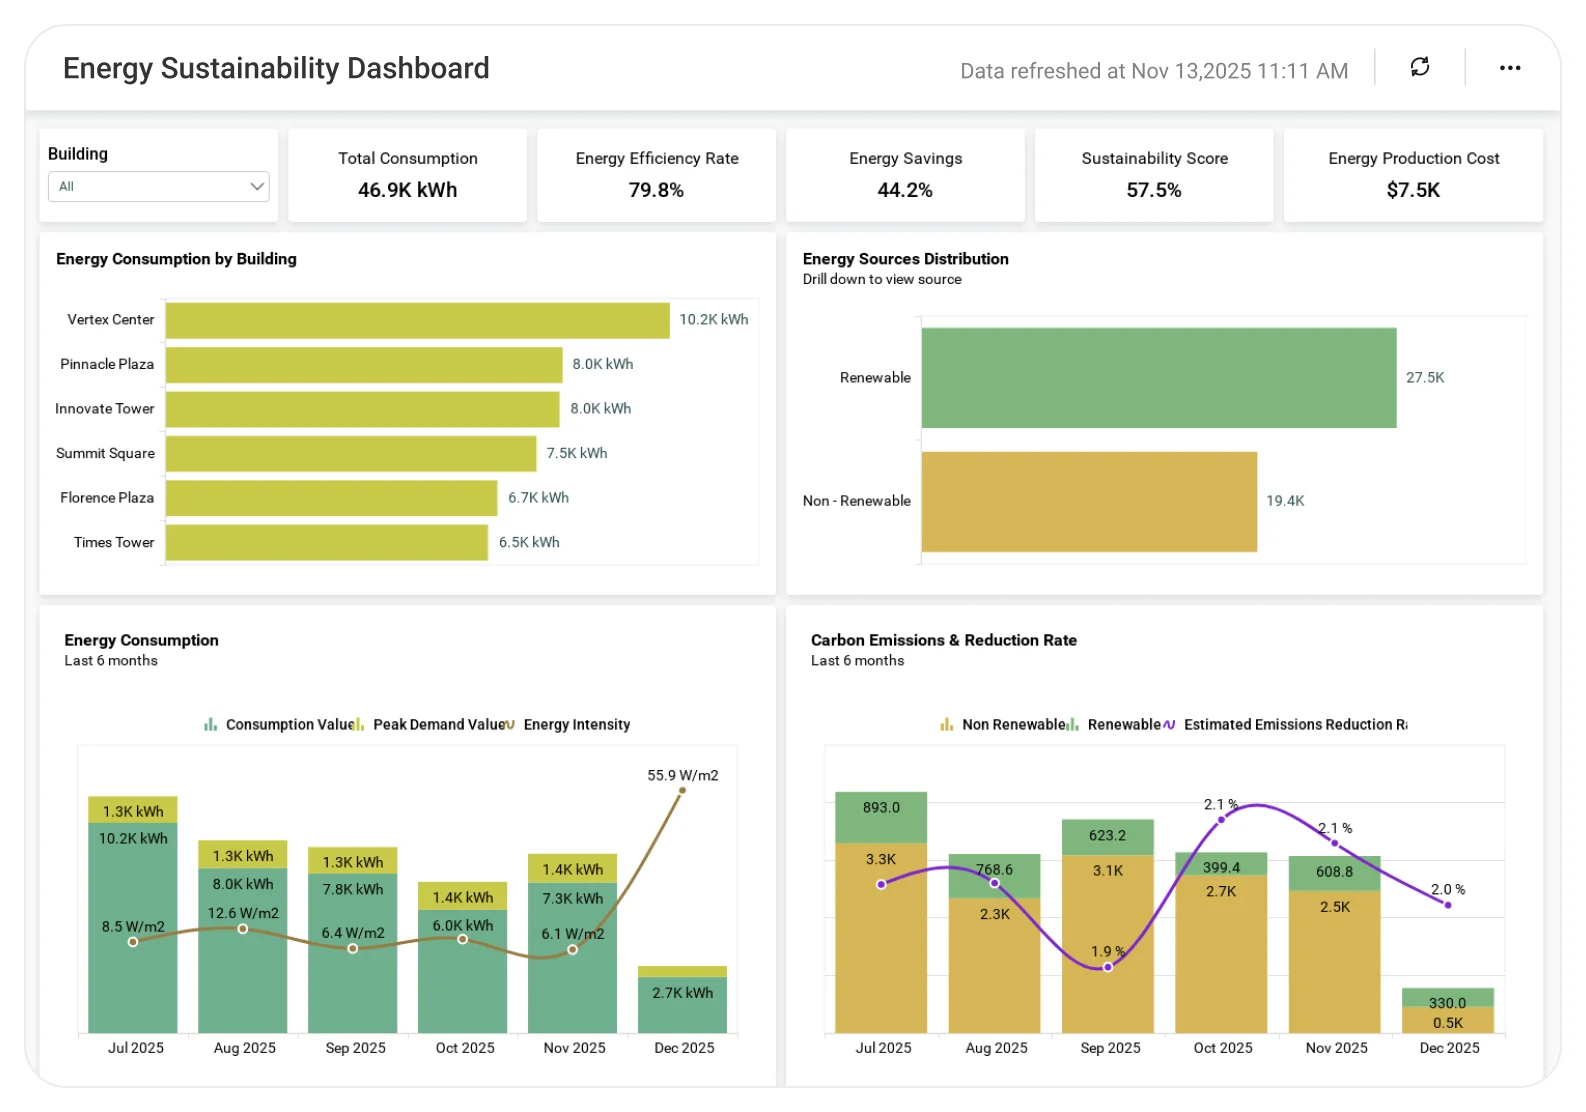
The Energy Sustainability Dashboard helps teams analyze energy consumption, emissions, renewable usage, and sustainability indicators, enabling better planning, reduced carbon footprint, and more responsible energy management decisions.
TL;DR
-
Monitor total energy consumption and efficiency trends in one unified dashboard.
-
Track renewable vs non-renewable energy usage to measure sustainability progress.
-
Identify high-consumption areas and inefficiencies across locations or departments.
-
Compare energy performance across sites to prioritize improvement initiatives.
-
Support cost reduction and ESG goals with data-driven energy sustainability insights.
What Is a Energy Sustainability Dashboard?
An Energy Sustainability Dashboard is an analytics solution that helps organizations understand how energy is consumed, where inefficiencies exist, and how sustainability initiatives are performing.
In Bold BI, this dashboard consolidates energy, utility, and operational data to uncover trends, measure progress, and support informed sustainability and energy management decisions.
Why Energy Sustainability Dashboard Matters
Energy management is a critical driver of cost control, regulatory compliance, and environmental responsibility.
When energy data is fragmented across systems:
-
Inefficiencies remain hidden.
-
Sustainability targets are hard to track.
-
Cost reduction opportunities are missed.
-
Environmental impact lacks transparency.
A centralized analytics dashboard enables organizations to move from reactive reporting to proactive, insight-driven energy sustainability management.
What You’ll Track
Using Bold BI dashboards, you will track important KPIs such as:
-
Total energy consumption: Energy usage trends across locations or operations to understand overall demand.
-
Renewable energy contribution: Share of energy sourced from renewables to measure sustainability progress.
-
Energy efficiency indicators: Energy use per unit, output, or area to identify inefficiencies.
-
Carbon impact metrics: Estimated emissions linked to energy usage to support environmental reporting and reduction goals.
All dashboards are fully customizable, allowing you to add KPIs or metrics as needed.
How It Works
-
Connect energy management systems, utility data, Excel, SQL databases or REST APIs.
-
Apply the Energy Sustainability Dashboard sample.
-
Combine energy, emissions, and operational data in one unified view.
-
Analyze insights by location, energy source, or time period.
-
Share dashboards with sustainability, operations, and leadership teams.
Why Bold BI Is the Right Fit for Energy Sustainability Analytics
-
Unified energy visibility: Bring consumption, efficiency, and sustainability data into a single analytics dashboard.
-
Centralized sustainability analysis: Evaluate energy usage and environmental impact together.
-
Comparative insights: Compare sites, departments, or energy sources to identify improvement opportunities.
-
Actionable drilldowns: Investigate spikes, inefficiencies, or underperforming sustainability initiatives.
-
Flexible deployment: Deploy dashboards in cloud or self-hosted environments.
Compare Options (at a glance)
| Feature | Bold BI | Energy Reports | Spreadsheets |
| Energy sustainability analytics | Yes | Limited | Manual |
| Renewable vs non-renewable analysis | Yes | Partial | Manual |
| Cross-location comparison | Yes | Limited | Manual |
| Trend & efficiency insights | Yes | Limited | No |
| Custom KPIs & drilldowns | Fully customizable | Fixed | Manual |