Agriculture Resource Monitoring Dashboard
Understand resource usage and field conditions to improve agricultural productivity and planning.
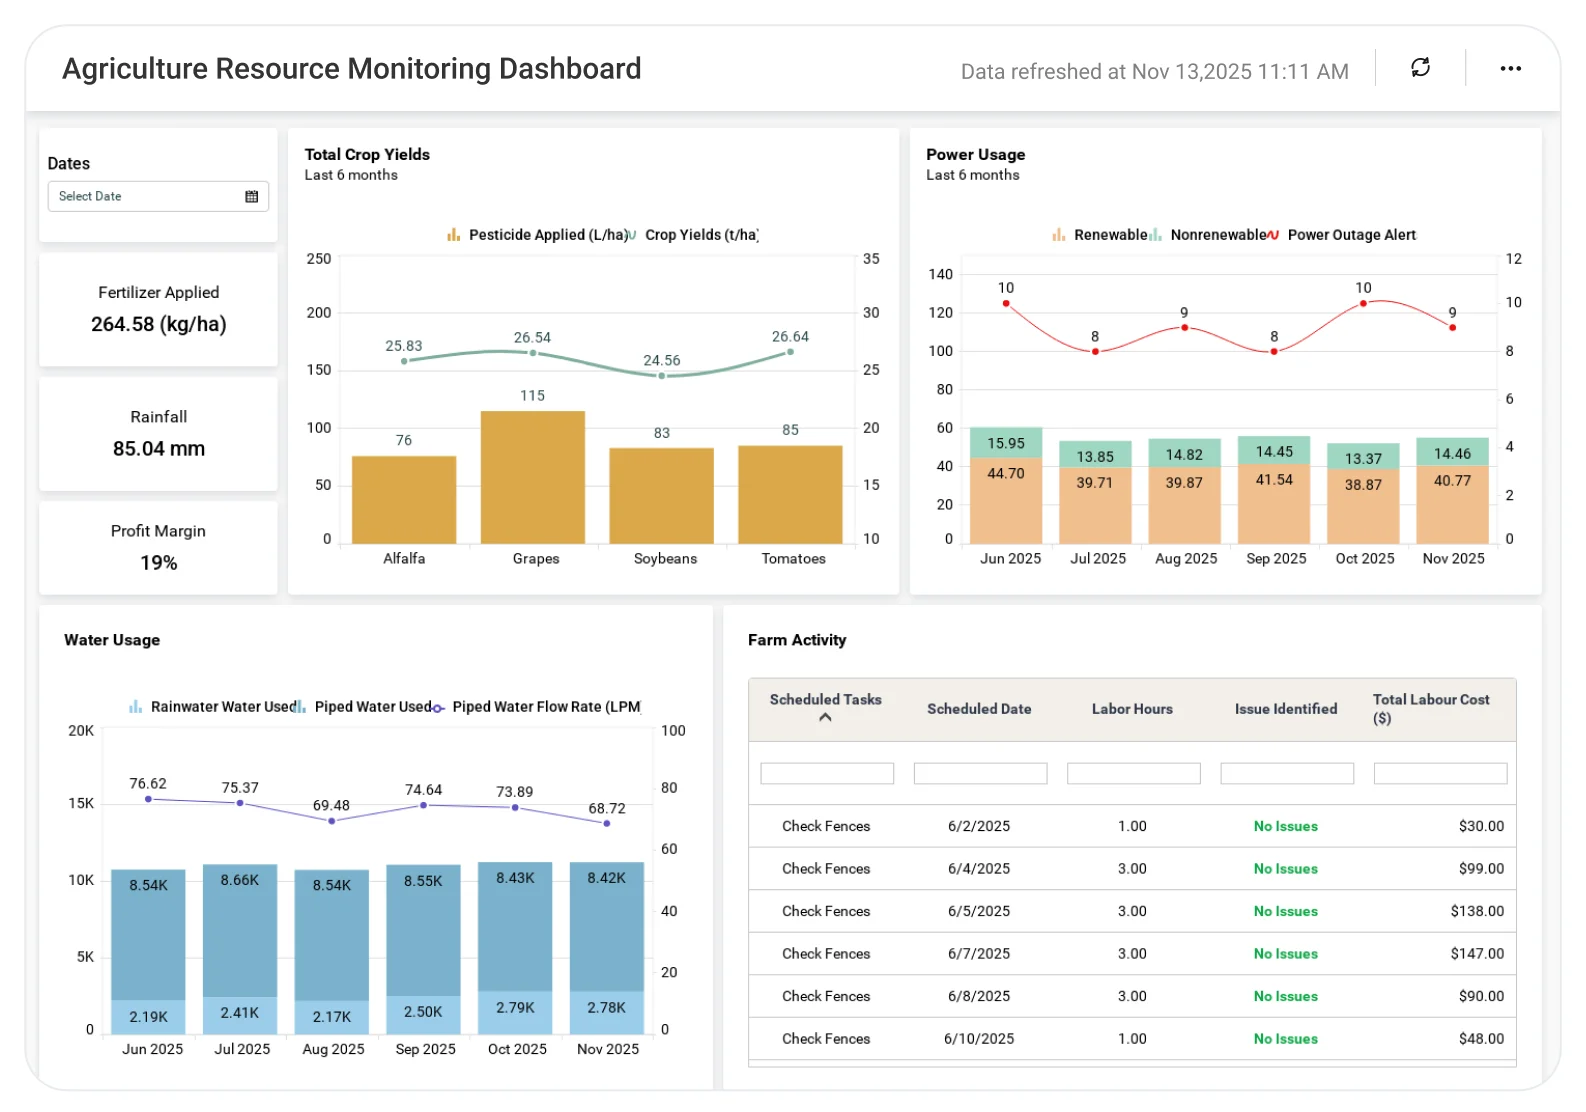
The Agriculture Resource Monitoring Dashboard helps farmers and agribusiness teams analyze water usage, soil conditions, crop health indicators, and resource availability, enabling better planning, efficient resource utilization, and improved crop outcomes.
TL;DR
-
Track water, energy, and input usage in one centralized dashboard across farms and fields.
-
Identify overuse, inefficiencies, and resource waste early using usage and trend insights.
-
Compare resource efficiency by field, crop, or farm to uncover best practices.
-
Optimize costs and improve productivity with data-backed resource planning.
-
Support sustainable farming decisions through measurable, actionable insights.
What Is a Agriculture Resource Monitoring Dashboard?
An Agriculture Resource Monitoring Dashboard helps agriculture teams track how efficiently resources such as water, energy, and other inputs are used across fields and farms.
In Bold BI, this dashboard consolidates data from farm systems, sensors, and operational records to reveal usage patterns, inefficiencies, and optimization opportunities, supporting better resource planning and more sustainable agricultural practices.
Why Agriculture Resource Monitoring Dashboard Matters
Efficient use of agricultural resources directly affects cost control, crop performance, and environmental impact.
When resource data is scattered across systems or tracked manually:
-
Inefficiencies remain hidden.
-
Input costs increase without clear justification.
-
Resource shortages or overuse are detected too late.
-
Sustainability goals are harder to achieve.
A centralized analytics dashboard enables agriculture teams to move from reactive adjustments to proactive, insight-led resource management.
What You’ll Track
Using Bold BI dashboards, you will track important KPIs such as:
-
Water usage distribution: Water consumption by field or crop to identify overuse and conservation opportunities.
-
Energy consumption trends: Energy usage patterns across operations to assess efficiency and cost impact.
-
Input utilization metrics: Usage of fertilizers, nutrients, and other inputs to optimize application rates.
-
Resource efficiency analysis: Comparison of resource utilization across fields, farms, or crop types to highlight best practices.
All dashboards are fully customizable, allowing you to add KPIs or metrics as needed.
How It Works
-
Apply the Agriculture Resource Monitoring Dashboard sample.
-
Combine resource, field, and crop data in one unified view.
-
Analyze insights by resource type, field, crop, or time period.
-
Share role-based dashboards with farm managers and agronomy teams.
Why Bold BI Is the Right Fit for Agriculture Resource Monitoring Analytics
-
Unified resource visibility: Bring water, energy, and input data into a single analytics dashboard.
-
Centralized efficiency analysis: Evaluate resource usage and productivity together rather than in silos.
-
Comparative field insights: Compare fields or farms to identify inefficiencies and optimization opportunities.
-
Actionable drilldowns: Investigate abnormal usage patterns or resource spikes in detail.
-
Flexible deployment: Deploy dashboards in cloud or self-hosted environments to support farms of any size.
Compare Options (at a glance)
| Feature | Bold BI | Farm Resource Reports | Spreadsheets |
| Resource utilization analytics | Yes | Limited | Manual |
| Cross-field comparisons | Yes | Partial | Manual |
| Efficiency trend analysis | Yes | Limited | No |
| Actionable drilldowns | Yes | Limited | No |
| Custom KPIs & visuals | Fully customizable | Fixed | Manual |