Irrigation Sensor Monitoring Dashboard
Improve water efficiency, reduce crop stress, and support data‑driven irrigation planning decisions through sensor‑driven insights.
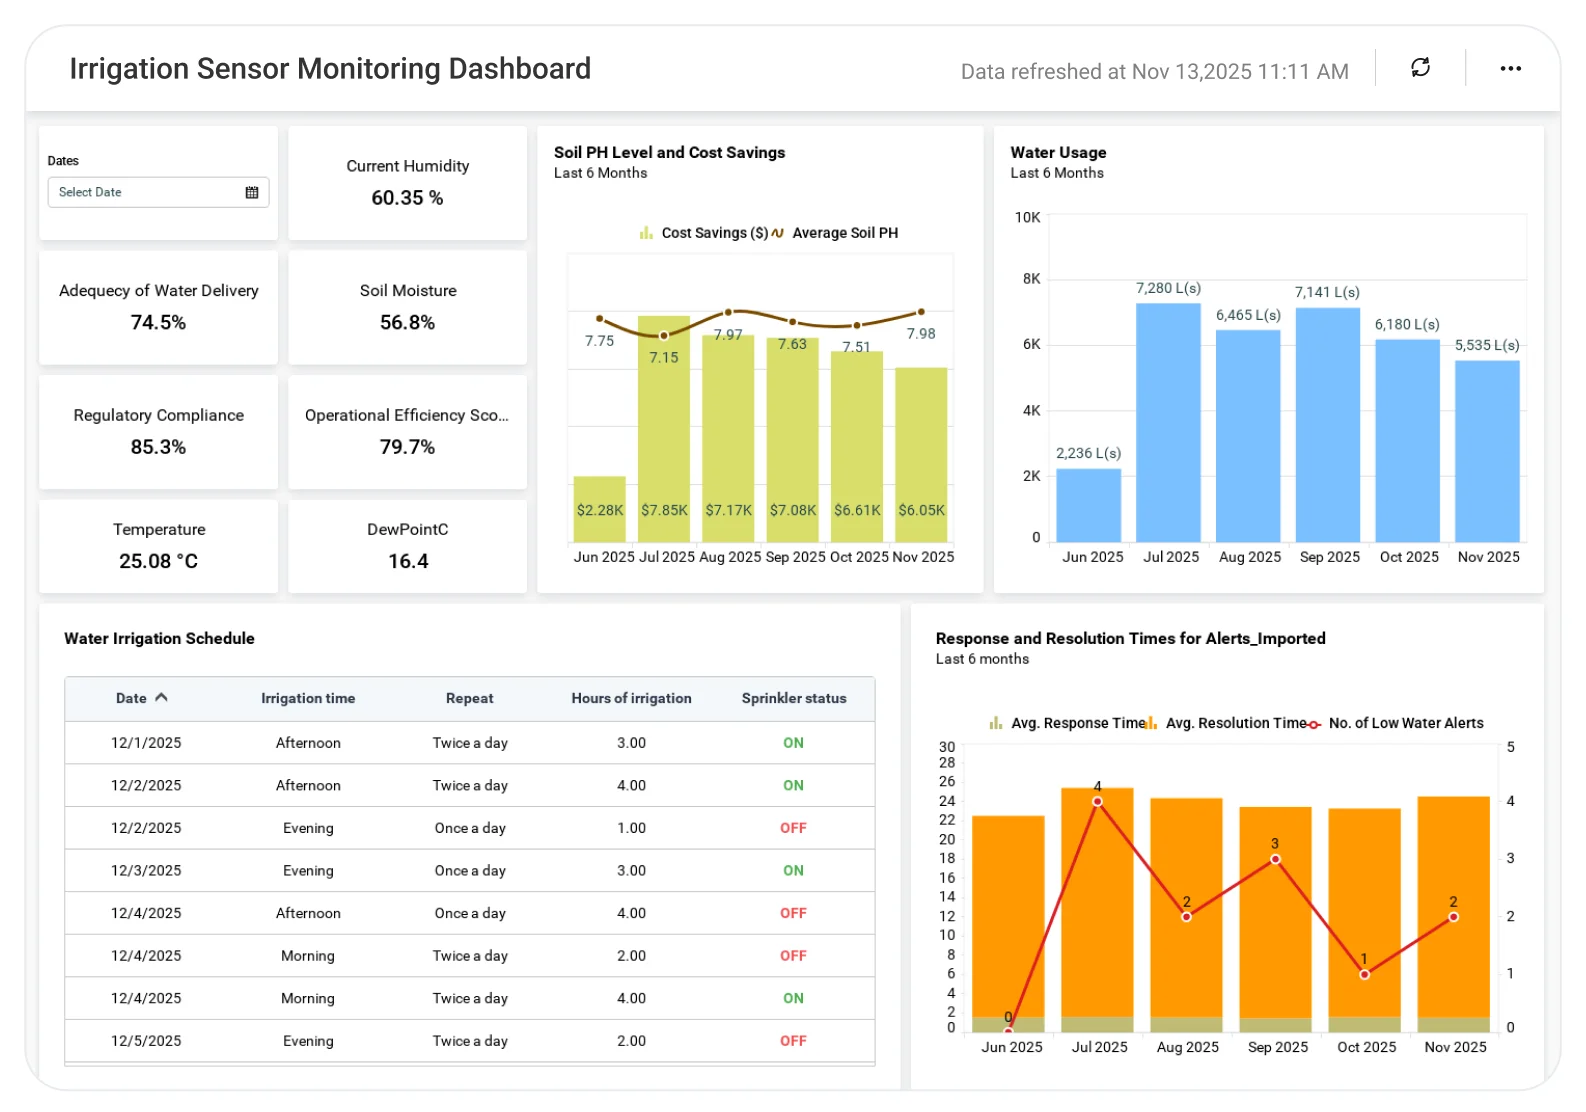
The Irrigation Sensor Monitoring Dashboard helps farmers and agronomy teams track soil moisture, irrigation activity, and field conditions in one centralized view, supporting timely irrigation decisions and optimized water usage.
TL;DR
-
Monitor soil moisture levels across fields and zones to understand real irrigation needs.
-
Track irrigation activity and water usage trends to avoid over- or under-watering.
-
Detect early signs of crop stress using sensor-driven field condition insights.
-
Compare irrigation performance across locations to identify inefficiencies and best practices.
-
Improve water efficiency and crop outcomes with data-driven irrigation planning.
What Is a Irrigation Sensor Monitoring Dashboard?
An Irrigation Sensor Monitoring Dashboard is an analytics solution that helps agricultural teams understand field conditions and irrigation effectiveness using data collected from sensors.
In Bold BI, this dashboard brings together sensor readings, irrigation data, and field information to uncover patterns, anticipate water needs, and support informed irrigation and crop management decisions.
Why Irrigation Sensor Monitoring Dashboard Matters
Efficient irrigation is critical for crop yield, water conservation, and cost control.
When sensor data and irrigation records are reviewed in isolation:
-
Over- or under-irrigation goes unnoticed.
-
Water usage increases unnecessarily.
-
Crop stress is identified too late.
-
Irrigation planning relies on guesswork.
A centralized analytics dashboard enables agriculture teams to move from reactive watering to data-driven, optimized irrigation strategies.
What You’ll Track
Using Bold BI dashboards, you will track important KPIs such as:
-
Soil moisture levels: Moisture readings across fields and zones to assess irrigation needs accurately.
-
Irrigation activity trends: Frequency and duration of irrigation events to understand usage patterns.
-
Sensor performance insights: Status and data consistency of sensors to ensure reliable field monitoring.
-
Field-level comparisons: Differences in moisture and irrigation performance across fields or locations.
All dashboards are fully customizable, allowing you to add KPIs or metrics as needed.
How It Works
-
Apply the Irrigation Sensor Monitoring Dashboard sample.
-
Combine sensor data and irrigation records in one unified view.
-
Analyze insights by field, zone, sensor, or time period.
-
Share role-based dashboards with farm managers and agronomy teams.
Why Bold BI Is the Right Fit for Irrigation Sensor Monitoring Analytics
-
Unified sensor insights: Bring soil moisture and irrigation data into a single analytics dashboard.
-
Centralized irrigation analysis: Evaluate water usage and field conditions together.
-
Comparative field intelligence: Compare zones or fields to identify inefficiencies and best practices.
-
Actionable drilldowns: Investigate abnormal moisture patterns or irrigation gaps in detail.
-
Flexible deployment: Deploy dashboards in cloud or self-hosted environments to support farms of any scale.
Compare Options (at a glance)
| Feature | Bold BI | Irrigation System Reports | Spreadsheets |
| Sensor data analytics | Yes | Limited | Manual |
| Field-level comparison | Yes | Partial | Manual |
| Irrigation trend analysis | Yes | Limited | Manual |
| Actionable drilldowns | Yes | Limited | No |
| Custom KPIs & visuals | Fully customizable | Fixed | Manual |