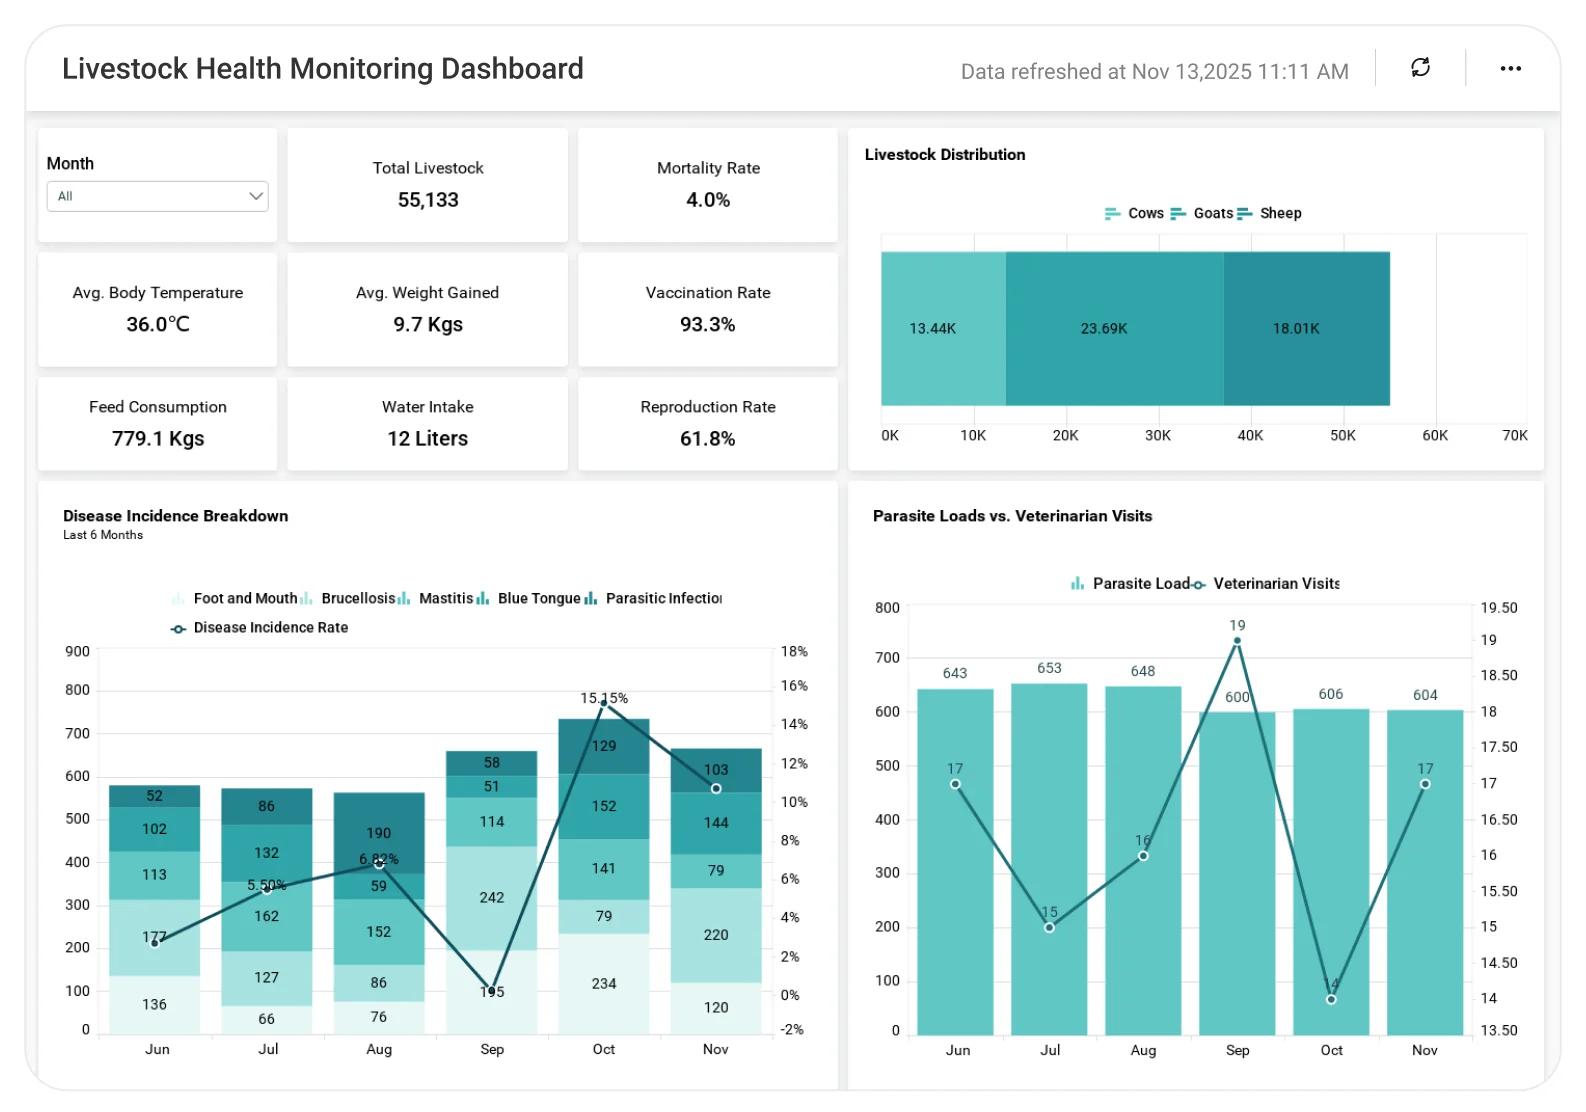
Livestock Health Monitoring Dashboard
Understand livestock health conditions to improve animal well-being and farm productivity.
The Livestock Health Monitoring Dashboard helps veterinary teams and farm managers analyze animal health indicators, disease patterns, and treatment outcomes, enabling early intervention, better care planning, and healthier livestock management.
TL;DR
-
Monitor livestock health status across herds and species to maintain overall herd well-being.
-
Track disease occurrence and spread patterns to detect health risks early.
-
Evaluate treatment effectiveness and recovery trends to improve animal care decisions.
-
Analyze mortality and survival rates over time to reduce losses and improve productivity.
-
Compare health performance across herds or farms to identify risks and best practices.
What Is a Livestock Health Monitoring Dashboard?
A Livestock Health Monitoring Dashboard is an analytics solution that helps animal healthcare and farm operations teams understand livestock health conditions, disease risks, and treatment effectiveness using consolidated data.
In Bold BI, this dashboard brings together veterinary records, farm data, and health indicators to identify patterns, prioritize interventions, and support proactive, data-driven herd management decisions.
Why Livestock Health Monitoring Dashboard Matters
Livestock health directly influences productivity, cost control, and animal welfare.
When health data, treatment logs, and farm records are reviewed in isolation:
-
Early disease indicators may go unnoticed.
-
Treatment outcomes are difficult to measure.
-
Mortality risks increase unexpectedly.
-
Herd management decisions become reactive.
What You’ll Track
Using Bold BI dashboards, you will track important KPIs such as:
-
Animal health distribution: Breakdown of healthy, sick, and at-risk animals across herds and species.
-
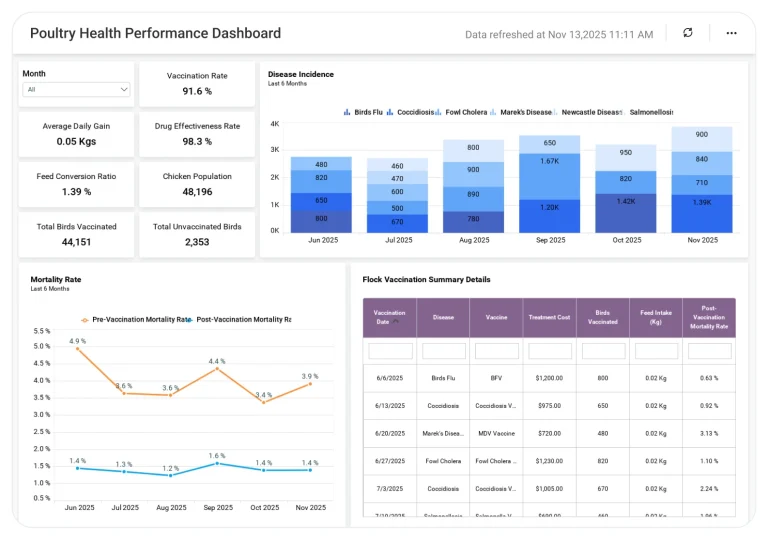
Disease occurrence trends: Frequency and spread of diseases to identify recurring or high-risk conditions.
-
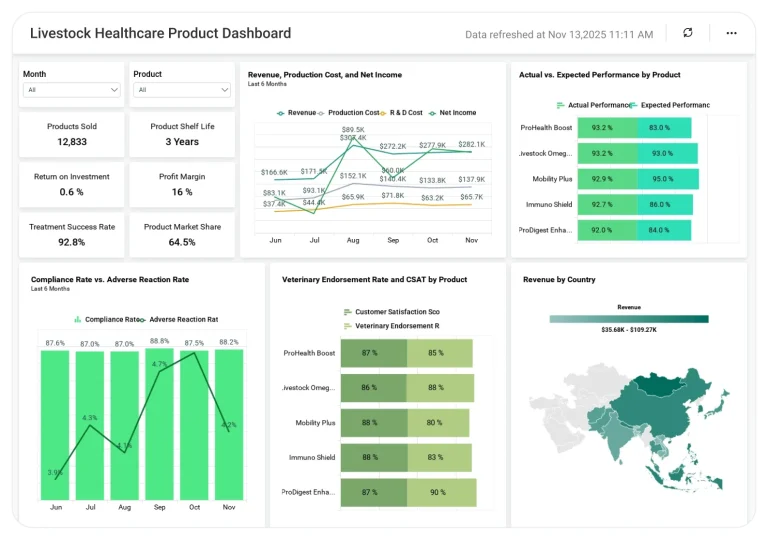
Treatment effectiveness metrics: Recovery rates, treatment duration, and response patterns by disease type.
-
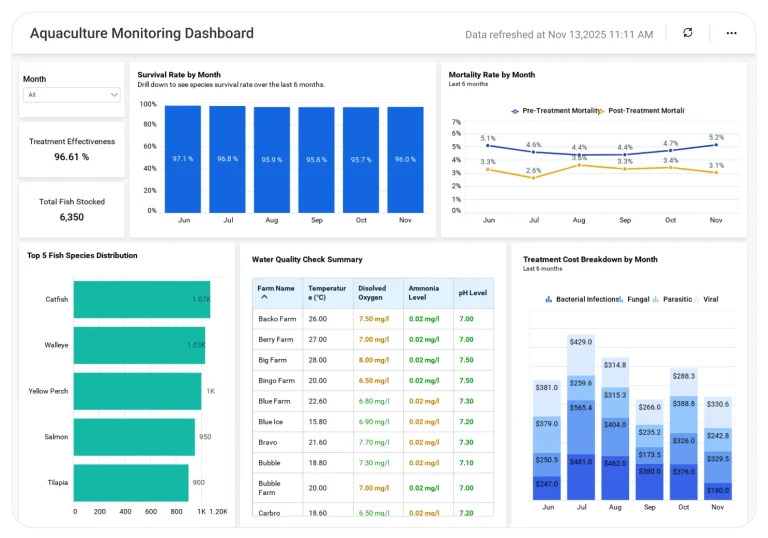
Mortality & survival analysis: Mortality rate, survival percentage, and health outcomes over time.
All dashboards are fully customizable, allowing you to add KPIs or metrics as needed.
How It Works
-
Apply the Livestock Health Monitoring Dashboard sample.
-
Combine animal health, treatment, and operational data in one unified view.
-
Analyze insights by farm, herd, species, or time period.
-
Share role-based dashboards with veterinarians, farm managers, and leadership.
Why Bold BI Is the Right Fit for Livestock Health Monitoring Analytics
-
Unified health insights: Bring veterinary records, treatment data, and farm information into one analytical view.
-
Centralized disease analysis: Evaluate disease patterns, treatment outcomes, and mortality drivers together.
-
Comparative herd intelligence: Compare herds, species, or farms to identify risks and best practices.
-
Actionable drilldowns: Explore disease trends, recovery gaps, and mortality factors through interactive analysis.
-
Flexible deployment: Deploy dashboards in cloud or self-hosted environments to support farms of any size.
Compare Options (at a glance)
| Feature | Bold BI | Farm Health Reports | Spreadsheets |
| Herd-level health analytics | Yes | Limited | Manual |
| Disease trend analysis | Yes | Partial | No |
| Treatment effectiveness insights | Yes | Limited | Manual |
| Cross-farm comparisons | Yes | Limited | Manual |
| Custom KPIs & drilldowns | Fully customizable | Fixed | Manual |