Pet Healthcare Product Performance Dashboard
Improve product effectiveness, optimize portfolio decisions, and drive better outcomes in pet healthcare through data‑driven insights.
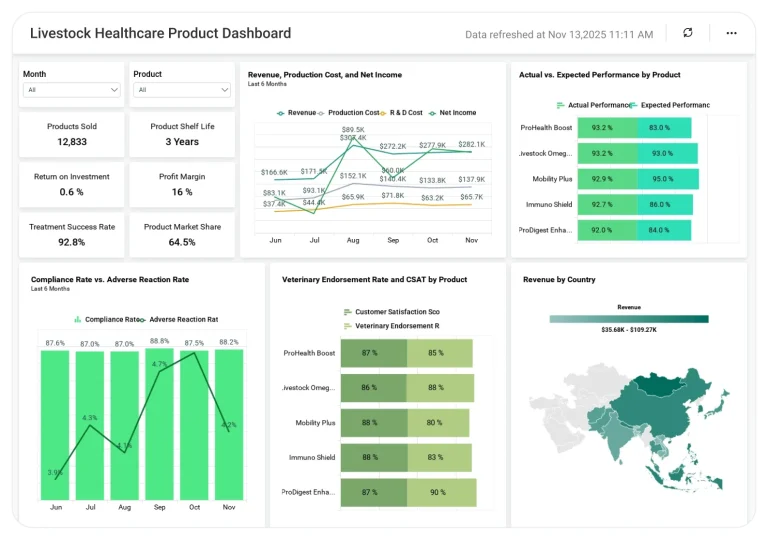
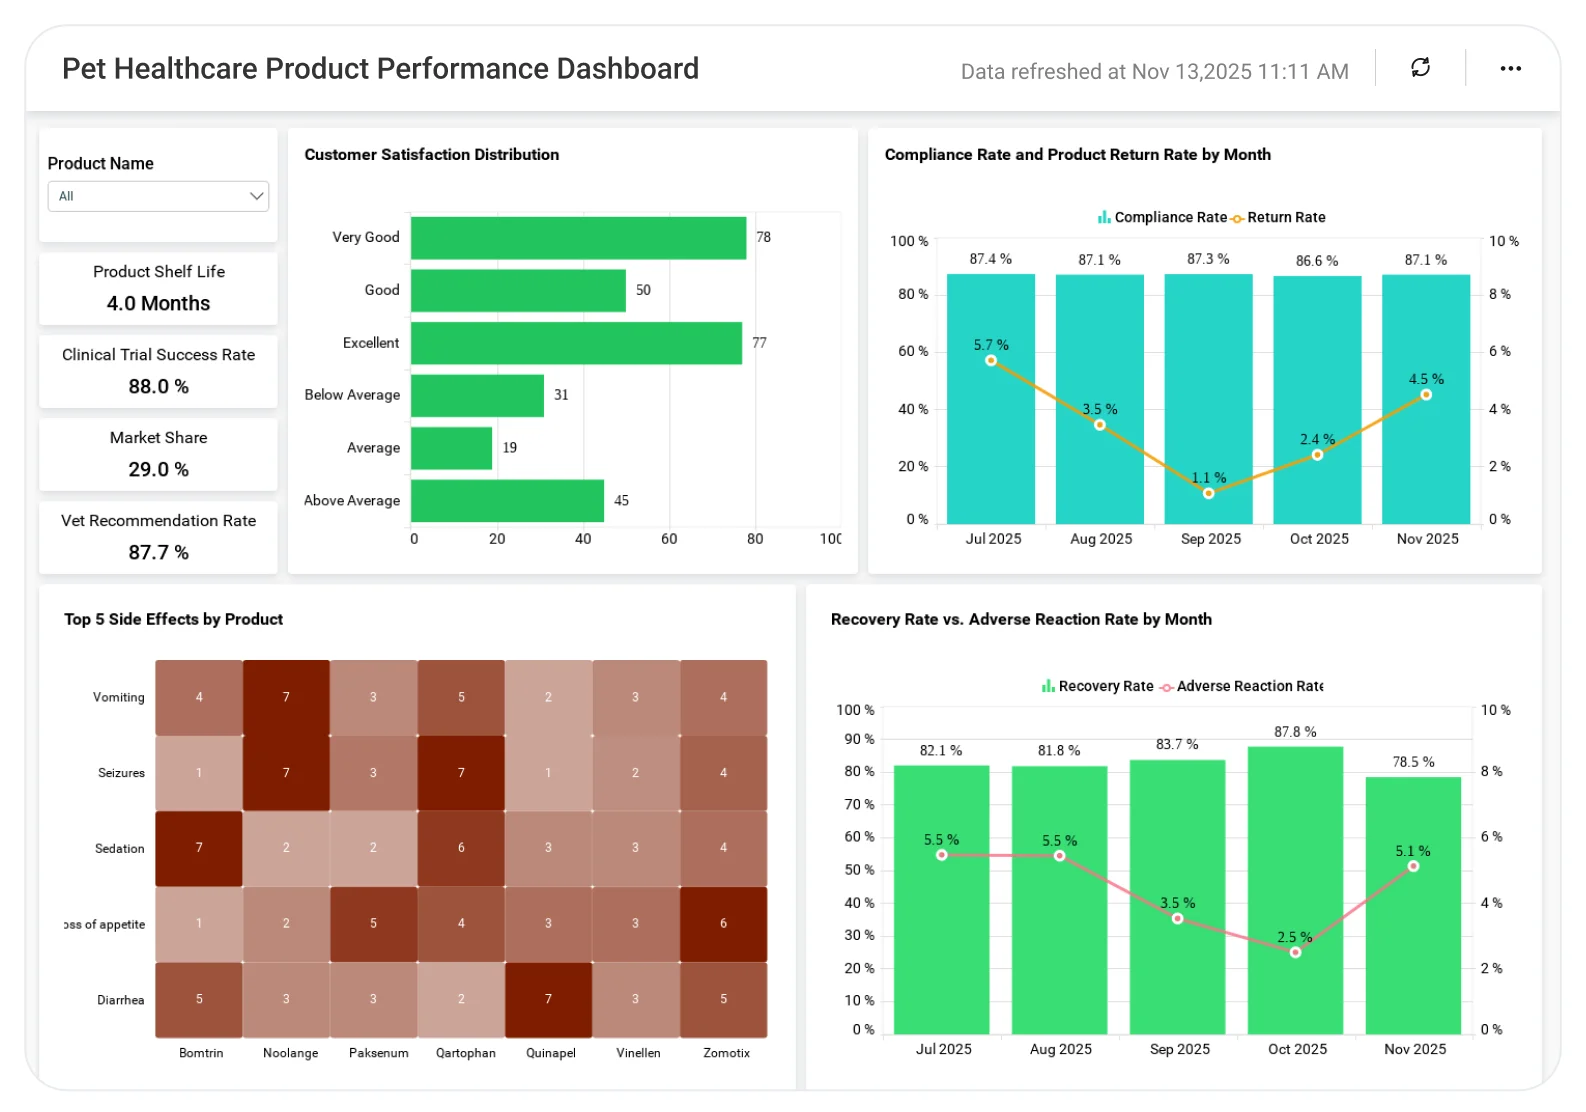
The Pet Healthcare Product Performance Dashboard helps animal healthcare companies, product managers, and veterinary teams analyze product usage, treatment outcomes, and adoption trends, supporting smarter portfolio planning and better pet health outcomes.
TL;DR
-
Track pet healthcare product usage trends across regions, clinics, and pet categories.
-
Compare performance across products and categories to identify top and underperformers.
-
Analyze treatment outcomes linked to specific products to evaluate real-world effectiveness.
-
Monitor adoption and demand trends over time to support forecasting and inventory planning.
-
Enable smarter portfolio and go-to-market decisions with data-driven pet healthcare insights.
What Is a Pet Healthcare Product Performance Dashboard?
A Pet Healthcare Product Performance Dashboard is an analytics solution that helps pet healthcare teams understand how products perform across real-world veterinary and pet care settings.
In Bold BI, this dashboard combines product data, treatment records, and market insights to reveal adoption patterns, compare effectiveness, and support evidence-based portfolio decisions.
Why Pet Healthcare Product Performance Dashboard Matters
Pet healthcare markets are highly competitive, regulated, and driven by measurable treatment outcomes.
When product performance data, treatment results, and market insights are reviewed separately:
-
High- and low-performing products are harder to distinguish.
-
Treatment effectiveness varies without clear visibility.
-
Demand forecasting becomes inconsistent.
-
Portfolio decisions rely more on assumptions than evidence.
A centralized analytics dashboard enables pet healthcare teams to align product strategy with real-world outcomes and market demand.
What You’ll Track
Using Bold BI dashboards, you will track important KPIs such as:
-
Product usage distribution: Adoption levels of pet healthcare products across regions, clinics, and pet categories.
-
Treatment outcome performance: Recovery and success rates associated with specific products or therapies.
-
Product category trends: Usage and effectiveness trends across vaccines, supplements, medications, and preventive care products.
-
Demand & adoption patterns: Changes in product demand over time to support forecasting and inventory planning.
All dashboards are fully customizable, allowing you to add KPIs or metrics as needed.
How It Works
-
Apply the Pet Healthcare Product Performance Dashboard sample.
-
Combine product, treatment, and market data in one unified view.
-
Analyze insights by product, category, pet type, or region.
-
Share role-based dashboards with product, sales, and veterinary teams.
Why Bold BI Is the Right Fit for Pet Healthcare Product Performance Analytics
-
Unified product insights: Bring product usage, treatment outcomes, and market data into a single analytics view.
-
Outcome-driven analysis: Evaluate product adoption alongside real treatment effectiveness.
-
Portfolio-level visibility: Compare products and categories to identify growth opportunities and performance gaps.
-
Actionable drilldowns: Explore product performance by pet type, clinic, or region for targeted decisions.
-
Flexible deployment: Deploy dashboards in cloud or self-hosted environments to support distributed pet healthcare teams
Compare Options (at a glance)
| Feature | Bold BI | Product Performance Reports | Spreadsheets |
| Product performance analytics | Yes | Limited | Manual |
| Outcome-linked insights | Yes | Partial | No |
| Portfolio comparison | Yes | Limited | Manual |
| Demand trend analysis | Yes | Limited | Manual |
| Custom KPIs & drilldowns | Fully customizable | Fixed | Manual |