
Energy Production and Consumption Dashboard
Understand energy consumption patterns to improve efficiency and reduce operational costs.
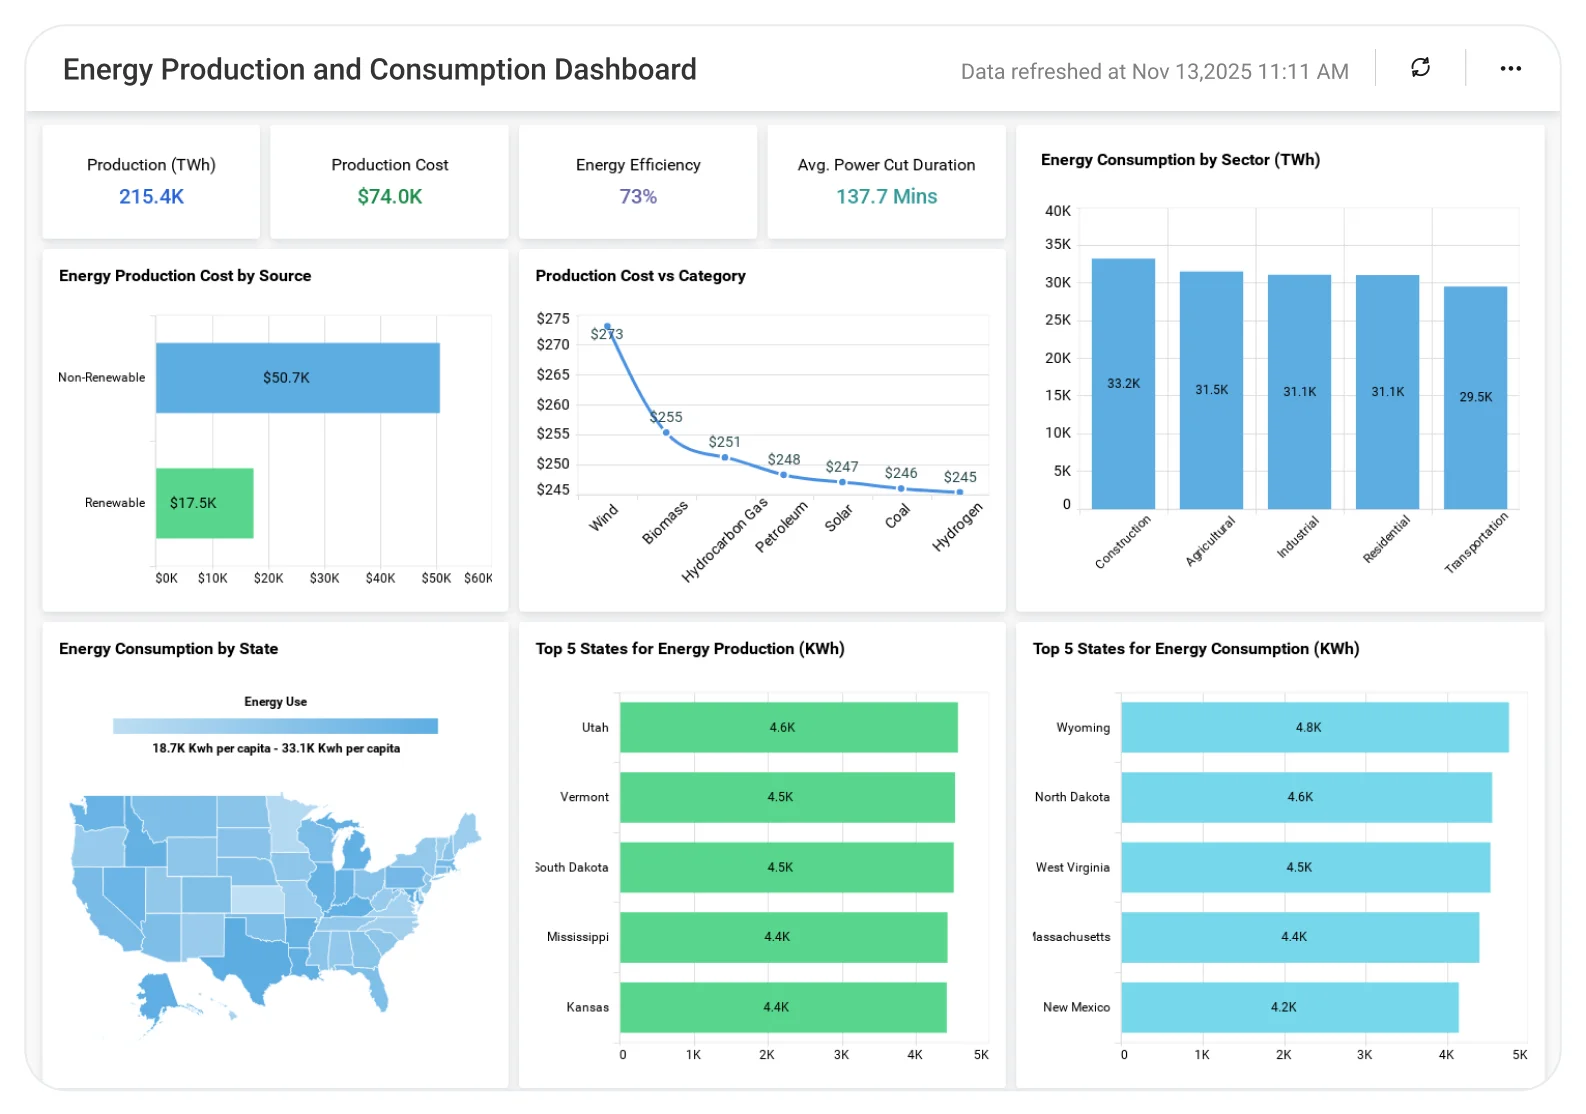
The Energy Monitoring Dashboard helps teams analyze energy usage, peak demand, and consumption trends across locations, enabling better energy planning, cost optimization, and more sustainable operations.
TL;DR
-
A full view of total energy consumption and production across all sources.
-
Monthly trends for usage and production costs.
-
Sector-level insights: residential, commercial, industrial, and more.
-
A breakdown of renewable vs. non-renewable energy usage.
-
An executive snapshot of demand patterns, cost fluctuations, and efficiency metrics.
What is an Energy Production and Consumption Dashboard?
It’s a real‑time view of energy demand, production costs, and usage patterns across sectors and sources.
In Bold BI, this becomes an interactive dashboard with charts showing consumption trends, cost breakdowns, monthly performance, and energy source efficiency, all automatically updated from your connected systems.
Why Energy Production and Consumption Dashboard Matters
Energy data often lives in silos across metering tools, ERPs, IoT readings, production logs, and cost spreadsheets. This leads to slow analysis, unclear trends, and reactive decision‑making.
Bold BI brings everything together in one analytics hub so you can answer questions such as:
-
How much energy is being consumed right now?
-
Which sectors or industries use the most energy?
-
What does it cost to produce and distribute energy?
-
Which sources or sectors are driving higher production costs?
-
What’s our mix of renewable vs. fossil fuel sources?
What You’ll Track
-
Overall energy consumption: Total usage, daily/monthly patterns, peak demand times, and sector-level contributions.
-
Monthly production costs: Cost trends across all energy sources, including budget comparisons and cost spikes.
-
Sector-wise consumption: How residential, commercial, and industrial sectors differ in demand and efficiency.
-
Energy source mix: Performance of each energy source, the balance between renewable and non-renewable energy, and each source’s cost contribution.
All dashboards are fully customizable, allowing you to add KPIs or metrics as needed.
How It Works
-
Connect your data SQL, Excel, ERPs, IoT meters, REST APIs.
-
Pick the Energy Monitoring sample dashboard.
-
Blend consumption, production, cost, and sector data.
-
Share dashboards with operations, finance, and leadership.
-
Set alerts for unusual consumption or cost spikes.
Why Bold BI Is the Right Fit for Energy Production and Consumption Analytics
-
Unified energy data visibility: Combine IoT, ERP, and sector data into a single, governed dashboard.
-
End-to-end performance insights: Track consumption, cost, source, and sector metrics in one view.
-
Deep drilldowns: Drill from overall energy performance down to specific sources or sectors.
Compare Options (at a glance)
| Feature | Bold BI | SCADA/EMS Standard Reports | Spreadsheets |
|---|---|---|---|
| Generation vs. load trends (hourly/daily/seasonal) | Yes | Limited | Manual |
| Unit/asset performance (availability, utilization, downtime) | Yes | Partial | Manual |
| Fuel mix & efficiency analytics (heat rate, yield) | Yes | Limited | Manual |
| Renewables tracking (solar/wind output, curtailment) | Yes | Partial | Manual |
| Peak demand, baseload & load-shape analysis | Yes | Limited | Manual |
| Emissions & sustainability KPIs (CO₂ intensity, targets) | Yes | Limited | Manual |
| Custom KPIs & dashboards | Fully customizable | Fixed | Manual |
Frequently Asked Questions
More Articles About Energy Consumption Dashboard
-
Energy Consumption Analytics: BI Insights
 Explains how BI helps reduce energy waste, improve budgeting, enable predictive maintenance, and benchmark performance.
-
Monitor Energy Consumption & Increase Your Revenue
Discusses embedded analytics for energy companies, benefits like effective consumption analysis, better source selection, and financial management.


