

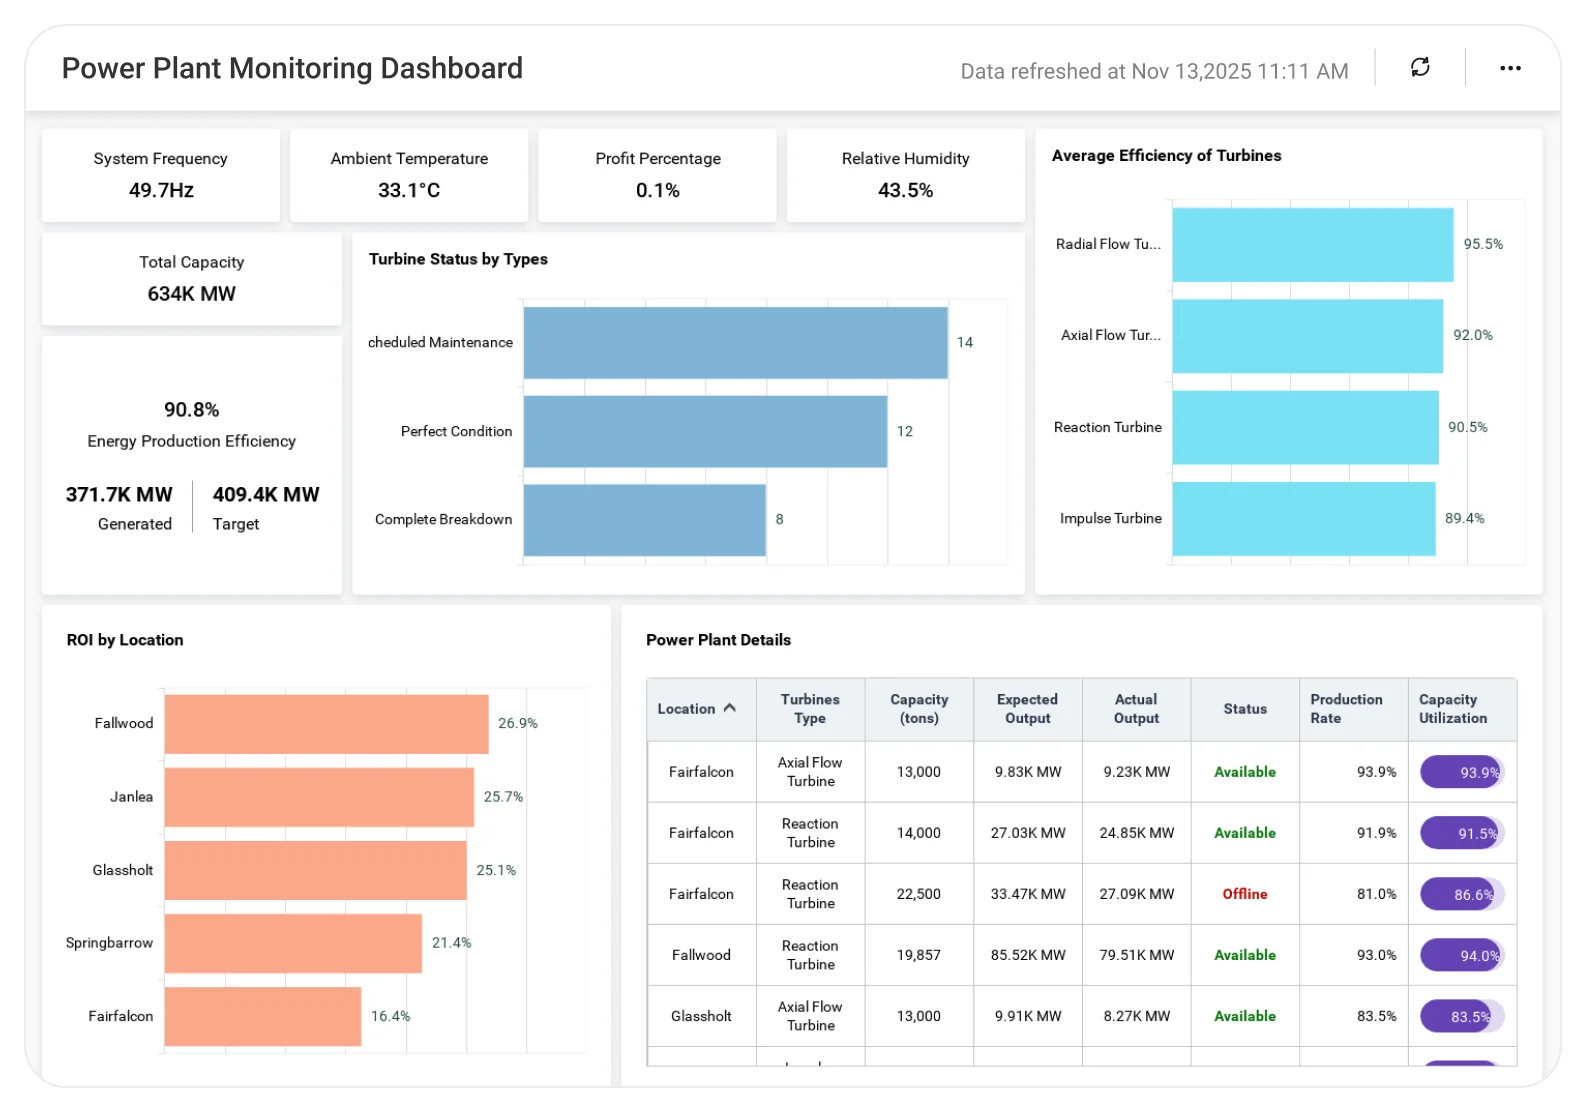
Power Plant Monitoring Dashboard
Understand power plant performance to improve efficiency, reliability, and cost control.
The Power Plant Dashboard helps operations teams analyze power generation, capacity utilization, fuel usage, and equipment performance, enabling better planning, reduced downtime, and more efficient energy operations.
TL;DR
-
Live Production Visibility : Output across all plants in real time.
-
Performance vs. Targets : Actual vs. expected generation.
-
Turbine Efficiency Metrics : Identify underperforming assets.
-
Environmental Impact Analysis : Conditions affecting output.
-
ROI Comparison : Profitability across plants.
What is a Power Plant Operations Dashboard?
A Power Plant Operations Dashboard is real-time analytics view that monitors energy production, equipment efficiency, and financial performance across power plants.
In Bold BI, this means interactive dashboards that combine live production data, environmental conditions, turbine metrics, and ROI updated continuously.
Why a Power Plant Operations Dashboard Matters
Power generation systems operate continuously, and even small inefficiencies can lead to major financial losses or service disruptions.
Without real‑time visibility:
-
Production issues go unnoticed.
-
Underperforming plants drain profitability.
-
Equipment inefficiencies are hard to diagnose.
-
ROI varies widely without clear insight.
Bold BI delivers real-time operational clarity, helping teams monitor performance, prevent downtime, and optimize energy output.
What You’ll Track
Using Bold BI dashboards, you will track important KPIs such as:
-
Real-time energy production & capacity: Total output, plant capacity, and target comparisons across all facilities.
-
Plant-level performance metrics: Actual vs. expected output, production rate, and operational status by plant.
-
Turbine efficiency & operating conditions: Turbine performance alongside frequency, temperature, and humidity.
-
ROI & profitability by plant: Return on investment comparisons to identify high- and low-performing assets.
All dashboards are fully customizable, allowing you to add KPIs or metrics as needed.
How It Works
-
Apply the Power Plant Operations Dashboard sample.
-
Blend production, efficiency, environmental, and financial data.
-
Monitor performance in real time with interactive widgets.
-
Share role-based dashboards with operations, engineering, and leadership teamsShape.
Why Bold BI Is the Right Fit for Power Plant Analytics
-
Unified plant performance view: Monitor production, efficiency, and ROI across multiple power plants in one dashboard.
-
Real-time operational insights: Detect production shortfalls instantly and compare actual output against targets.
-
Plant- & equipment-level drilldowns: Drill from fleet-wide performance down to individual plants and turbine efficiency by type and location.
-
Profitability & planning insights: Analyze ROI trends to guide maintenance, upgrades, and long-term investment decisions.
-
Flexible deployment: Deploy securely in the cloud or self-hosted environments to meet energy operations needs.
Compare Options (at a glance)
| Feature | Bold BI | SCADA Reports | Spreadsheets |
| Live production monitoring | Yes | Yes | No |
| Cross-plant comparison | Yes | Limited | Manual |
| ROI & profitability analysis | Yes | No | Manual |
| Turbine efficiency insights | Yes | Partial | Manual |
| Deployment | Cloud / self-hosted | On-prem only | Local |
Frequently Asked Questions
More Articles About Power Plant Operations Dashboard
-
Driving Growth: BI Dashboard Implementation for Power Plant Efficiency
 This blog explains how BI dashboards optimize power plant operations by tracking KPIs, reducing downtime, and improving efficiency.
-
Empower Manufacturing Industry with Embedded Analytics
This blog shows how embedded analytics delivers real-time insights to manufacturing teams, boosting productivity and operational control.
-
15 Essential KPI Dashboard Examples for Your Business
This blog highlights key KPI dashboards that help businesses monitor performance, streamline processes, and make data-driven decisions.


