

School Improvement Grants 2010 Dashboard
Understand how grant funding impacts school performance and student outcomes.
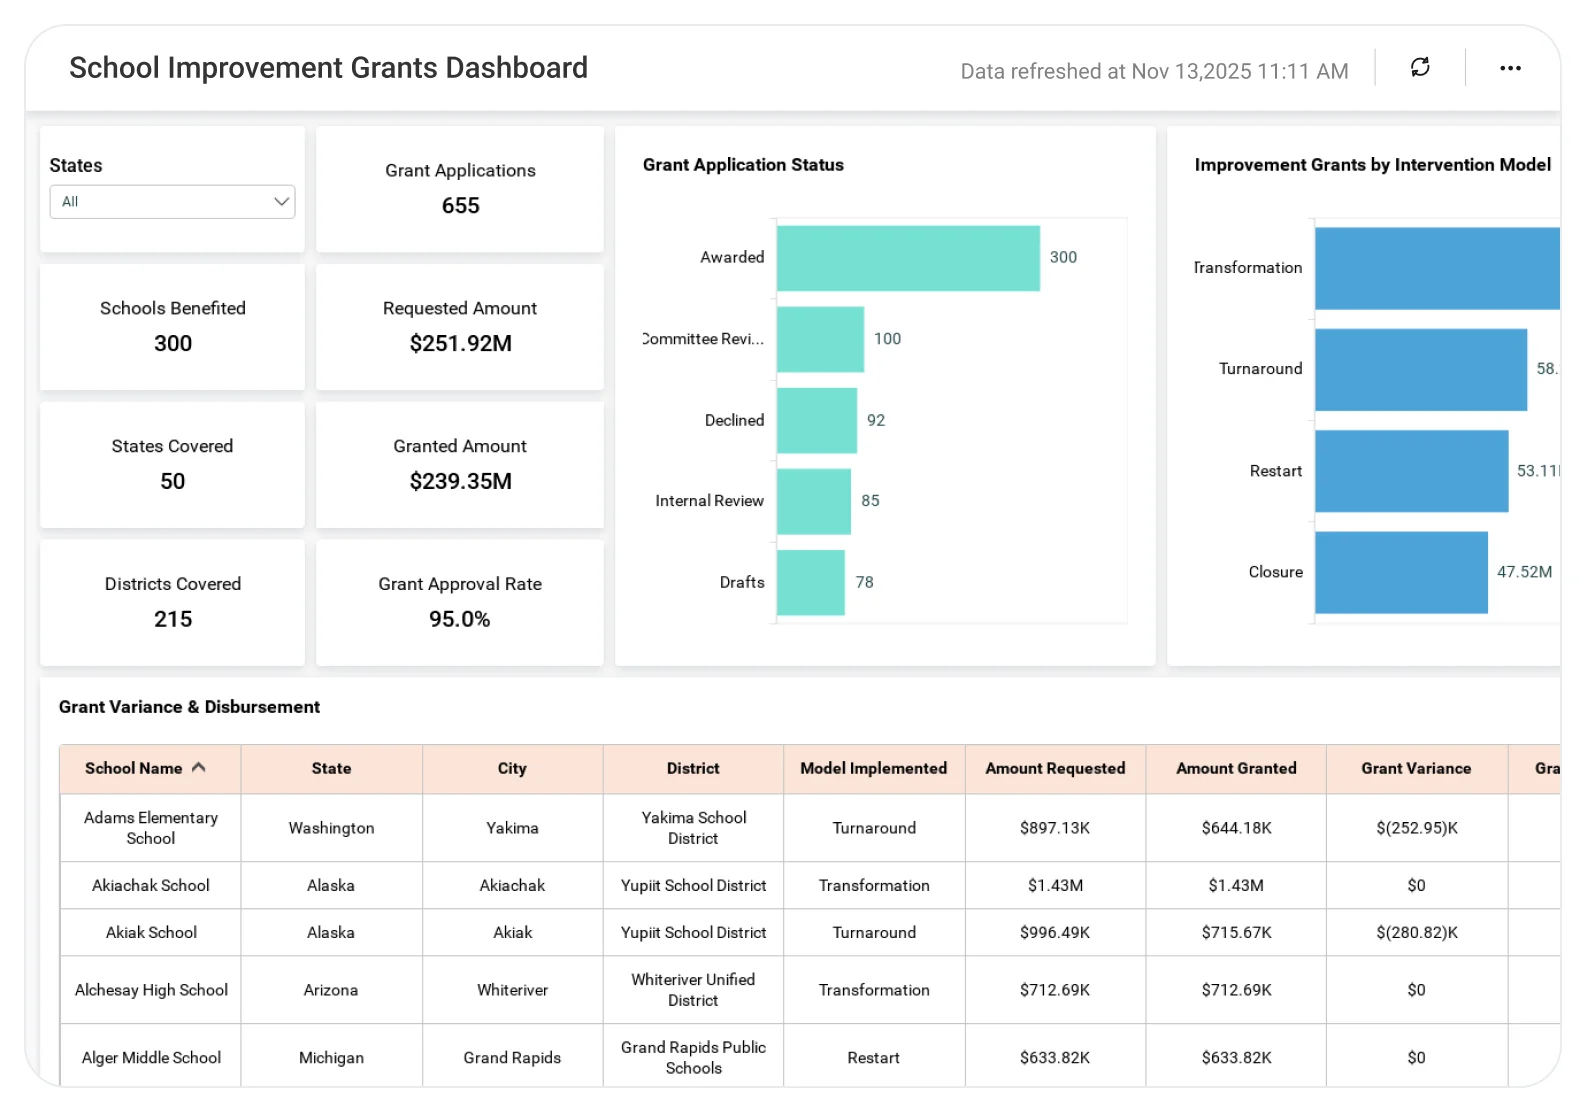
The School Improvement Grants 2010 Dashboard helps education leaders analyze funding allocation, school performance indicators, and improvement progress, enabling better accountability, informed policy decisions, and more effective use of education grants.
TL;DR
-
Total funding distributed under the program.
-
Grant allocation by state and school.
-
Funding breakdown by intervention model.
-
Top schools by amount granted.
-
Adoption of improvement models across schools.
What Is a School Improvement Grants Dashboard?
A School Improvement Grants Dashboard is a visual analytics solution that helps agencies monitor education funding allocation, school participation, and intervention strategies across regions.
In Bold BI, it becomes an interactive dashboard with KPIs, charts, maps, and filters that update automatically from education and grant data sources.
Why School Improvement Grants Dashboard Matters
Large-scale education funding programs require accountability and measurable outcomes.
Without a centralized dashboard:
-
Funding distribution is difficult to assess.
-
Program effectiveness is difficult to evaluate consistently.
-
Policy decisions rely on fragmented reports.
What You’ll Track
-
Total grant funding: Overall amount of money distributed through the School Improvement Grants program.
-
State-wise funding distribution: Grant amounts received by each state to identify regional allocation patterns.
-
School-level funding: Individual schools and the amount of funding they received.
-
Intervention model adoption: Number of schools implementing transformation, turnaround, restart, or closure models.
-
Top-funded schools: Schools receive the highest grant amounts for focused performance review.
All dashboards are fully customizable, allowing you to add KPIs or metrics as needed.
How It Works
Why Bold BI Is the Right Fit for School Grants Analytics
-
Unified public sector data visibility: Combine grant records, school data, and program metrics from multiple sources into one dashboard.
-
Centralized initiative reporting: Track funding, school participation, and intervention models in a single, reliable view.
-
Geographic analysis: Compare allocations and outcomes across states and schools using interactive maps.
-
Policy & program evaluation: Support data-driven reviews, accountability, and outcome analysis for public initiatives.
-
Secure & compliant analytics: Protect sensitive data with enterprise-grade security, including Single Sign On, Role Based Access Control and Row Level Security.
-
Flexible deployment: Deploy dashboards securely in cloud or self-hosted environments to meet public sector requirements.
Compare Options (at a glance)
| Feature | Bold BI School Improvement Grants Dashboard | Static Reports | Spreadsheets |
| Funding distribution analysis | Yes | Limited | Manual |
| State & school-level insights | Yes | Limited | Manual |
| Intervention model tracking | Yes | Limited | Manual |
| Geographic visualization | Yes | Limited | No |
| Executive-ready dashboards | Yes | Limited | No |
Frequently Asked Questions
More articles about School Improvement Dashboard
-
Improve School Grants Management with Embedded Analytics
 The blog explains how embedded analytics can help government education departments better manage and monitor improvement grants to boost school development and performance.
-
Educational Insights: Analyzing Student Performance with BI Dashboards
The blog highlights how business intelligence (BI) dashboards transform the way educators and administrators analyze student performance. These dashboards consolidate complex academic data into visual, interactive insights that support data-driven decision-making to enhance learning outcomes.


