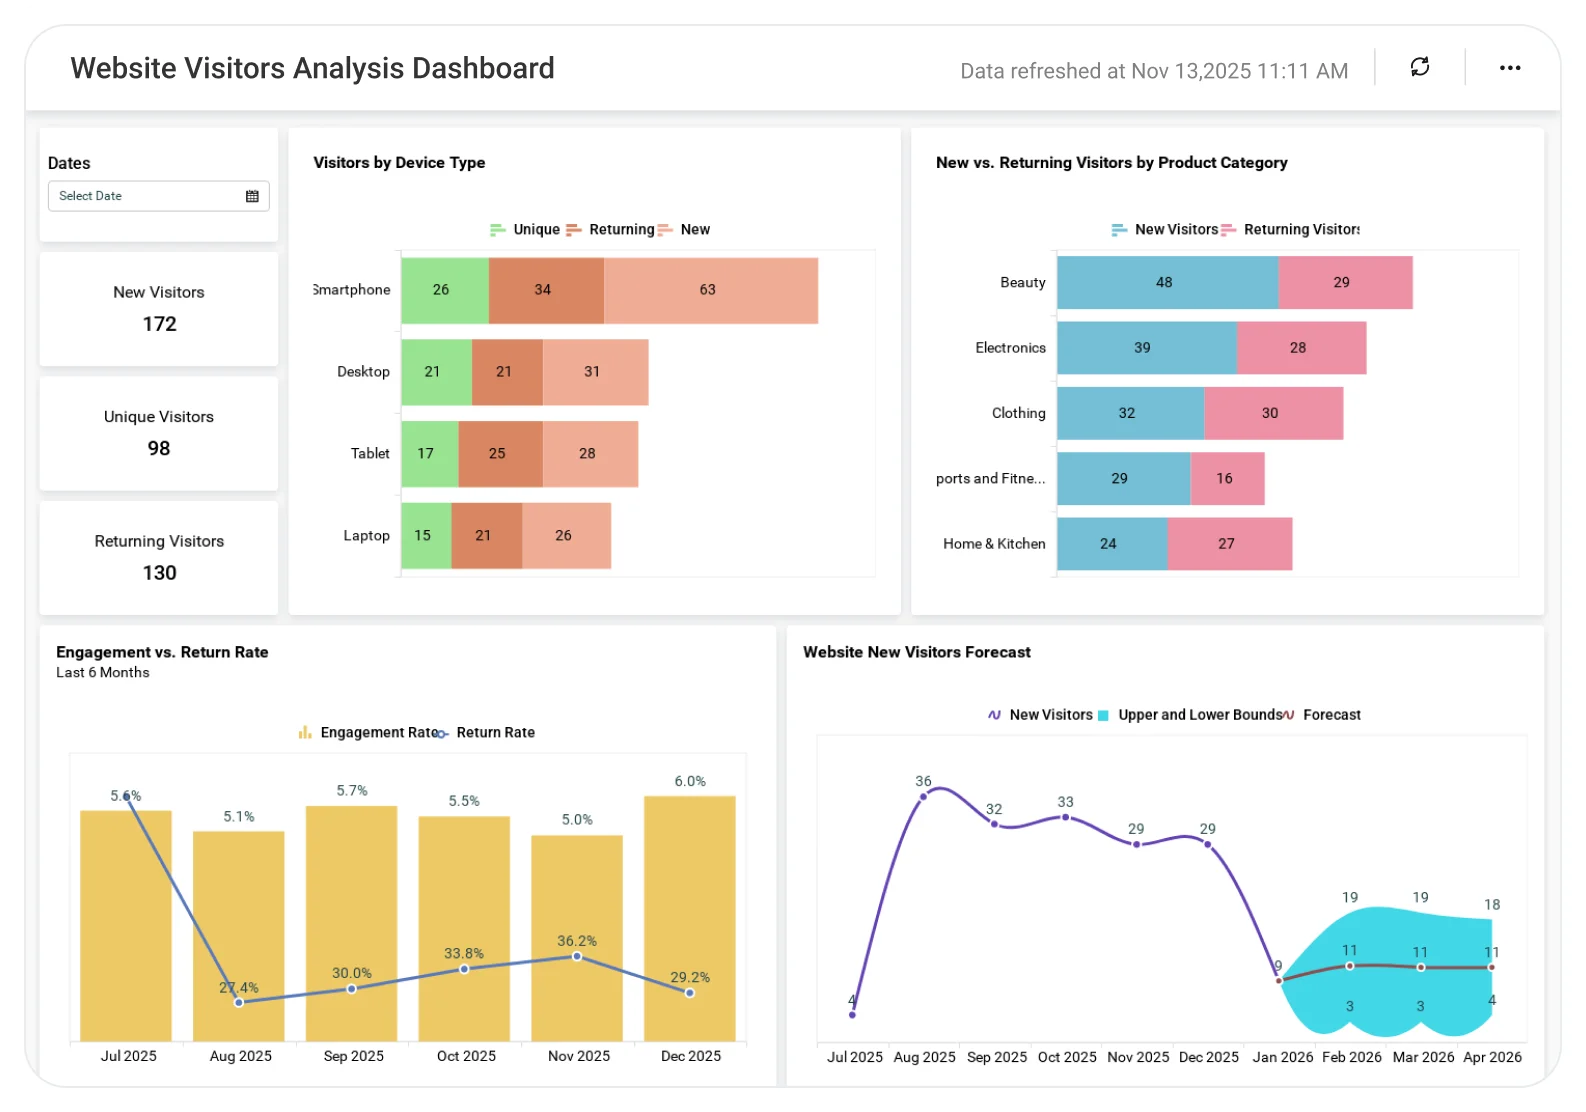
Website Visitor Analysis Dashboard
Understand visitor behavior and predict traffic trends to improve website performance.
The Website Visitor Analysis Dashboard helps teams analyze visitor patterns, traffic sources, and engagement trends, enabling data-driven predictions, better content strategies, and improved user experience.
TL;DR
-
Total website visitors and purchasers.
-
Visitor-to-customer conversion trends.
-
Forecasted purchaser counts and sales outlook.
-
Top referral and acquisition sources.
-
Product category–wise purchase insights.
What Is a Website Visitor Analysis Dashboard?
A Website Visitor Analysis Dashboard is a visual analytics solution that helps organizations monitor website traffic, conversion rates, referral sources, and product demand over time.
In Bold BI, it becomes an interactive dashboard with KPIs ,charts automatically updated from web and sales data sources.
Why a Website Visitor Analysis Dashboard Matters
Online performance depends on understanding how visitors behave and what drives conversions.
Without a centralized analytics dashboard:
-
Conversion gaps are hard to identify.
-
Sales forecasts lack context.
-
Marketing effectiveness is unclear.
Bold BI combines traffic, conversion, and sales data into one dashboard so teams can make smarter, data-backed decisions.
What You’ll Track
-
Visitor and purchaser volume: Total website visitors, purchasers, and trends across selected date ranges.
-
Conversion performance: Monthly comparison of visitors versus purchasers to evaluate conversion efficiency.
-
Sales and purchaser forecasts: Forecasted purchaser counts and expected sales trends to support planning
-
Customer acquisition sources: Breakdown of purchasers by referral channels to assess marketing effectiveness.
-
Product and category demand: Purchases by product category with drilldowns into subcategories and items.
All dashboards are fully customizable so you can add KPIs or metrics as needed.
How It Works
-
Select the Website Visitor Analysis Dashboard sample.
-
Blend visitor traffic, conversion, referral, sales, and forecast data in one view.
-
Share role-based dashboards with marketing, eCommerce, and leadership teams.
-
Track visitor behavior, improve conversions, and plan campaigns using forecast insights.
Why Bold BI Is the Right Fit for Website Visitor Analytics
-
Unified performance reporting: Track traffic, conversions, and sales together in a single view.
-
Predictive planning: Forecast future purchaser trends to plan campaigns more effectively.
-
Deep performance analysis: Drill down into category-level and product-level insights.
-
Channel optimization: Identify high-performing referral channels and optimize marketing spend.
-
Flexible deployment: Deploy in the cloud or self-host to meet digital team requirements.
-
Growth-focused dashboards: Support data-driven growth and conversion optimization.
Compare Options At a Glance
| Feature | Bold BI Website Visitor Analysis Dashboard | Web Analytics Reports | Spreadsheets |
| Visitor & purchaser tracking | Yes | Limited | Manual |
| Conversion trend analysis | Yes | Limited | Manual |
| Sales & purchaser forecasting | Yes | Limited | No |
| Referral source insights | Yes | Limited | Manual |
| Product-level drilldowns | Yes | Limited | No |
Frequently Asked Questions
More Articles About Website Traffic & Conversion Analytics
-
Transform Your Web Traffic Analysis with Area Chart Visuals
 Explores how area charts help visualize website traffic growth, visitor trends, and conversion patterns over time, making it easier to spot peaks, drops, and long-term performance changes.
-
Monitor & Increase Website Traffic Using Embedded Analytics
Shows how embedded analytics enables teams to track visitor behavior, referral sources, and conversion performance directly within business applications thus supporting faster optimization and growth decisions.