LinkedIn Analytics Dashboard
Understand LinkedIn performance to improve engagement, reach, and content strategy.
The LinkedIn Analytics Dashboard helps teams analyze follower growth, post performance, impressions, and engagement metrics, enabling better content planning, audience targeting, and stronger social media outcomes.
TL;DR
-
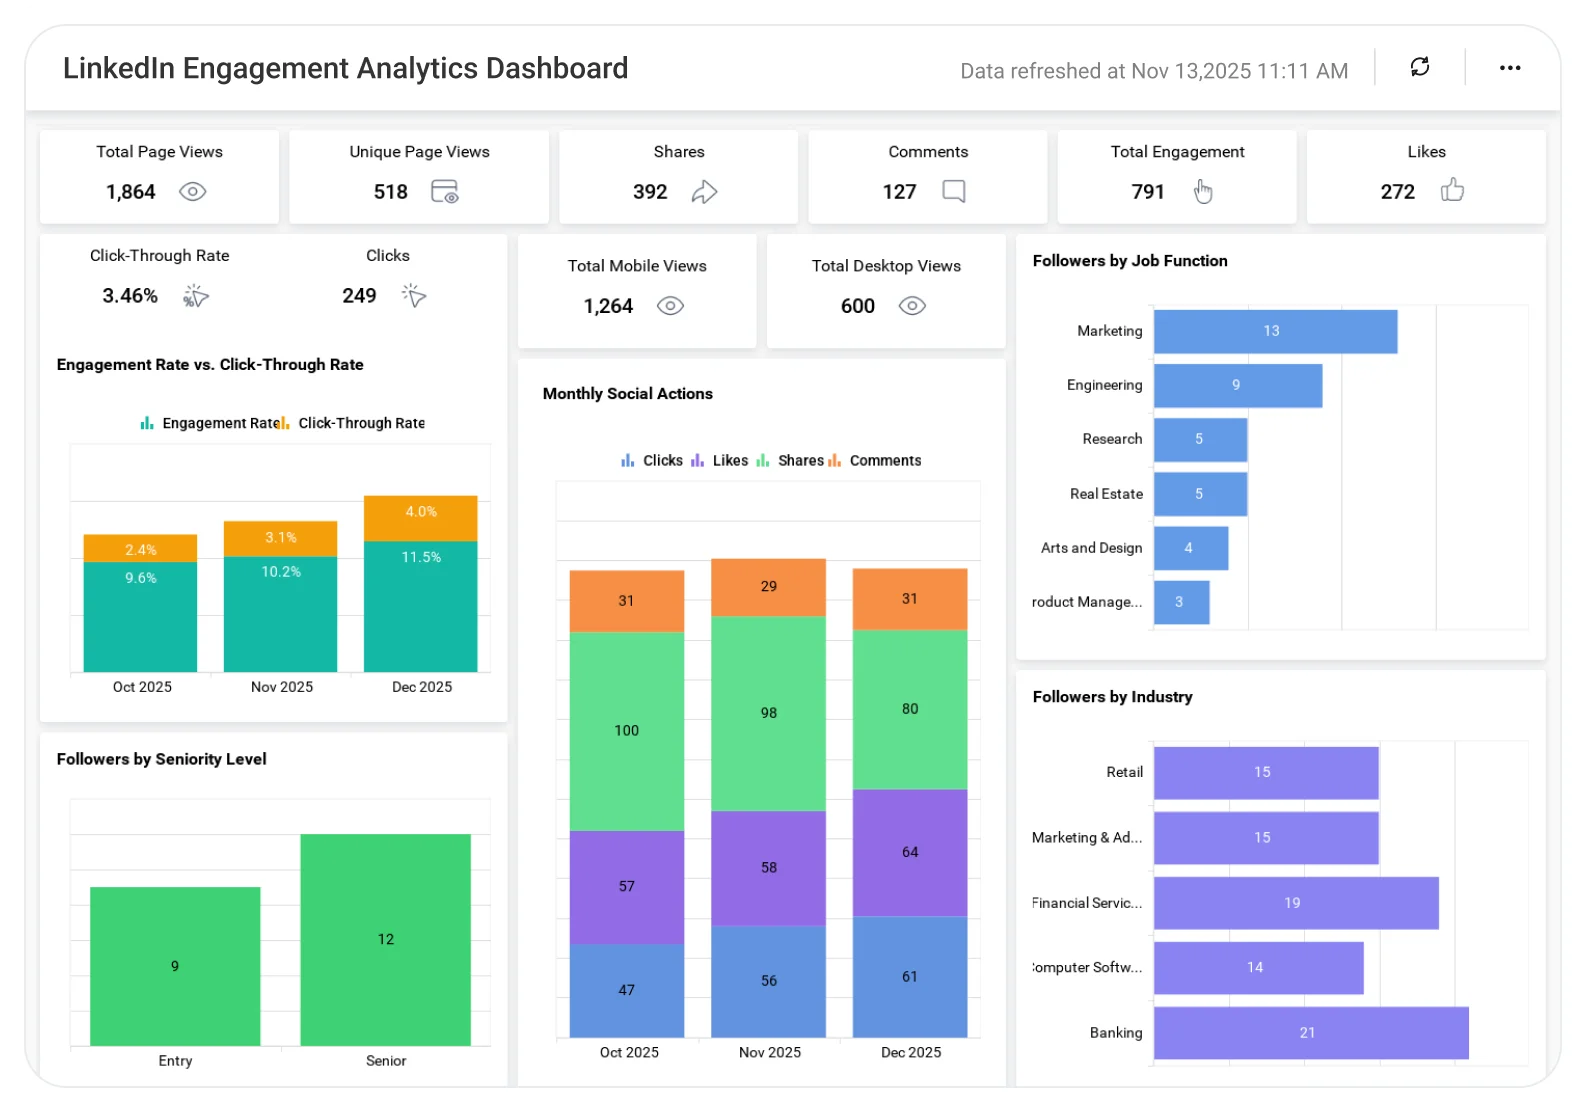
Overall and unique page traffic trends.
-
Engagement performance compared with click-through behavior.
-
Impressions and unique impressions over time.
-
Weekly interaction patterns across social actions.
-
Audience breakdown by role, industry, and seniority.
What Is a LinkedIn Analytics Dashboard?
A LinkedIn Analytics Dashboard is a visual reporting layer that tracks page performance, engagement trends, reach metrics, and follower demographics in one place.
In Bold BI, it becomes an interactive dashboard with filters and trend views that help marketing teams analyze LinkedIn performance without manual reporting.
Why LinkedIn Analytics Dashboard Matters
LinkedIn plays a critical role in brand credibility, lead generation, and thought leadership. But native analytics often make it difficult to connect performance trends with audience behavior.
Without a centralized dashboard:
-
Engagement patterns are hard to interpret.
-
Content success is difficult to replicate.
-
Audience insights remain underused.
Bold BI presents LinkedIn metrics in a clear, visual format so teams can understand what’s working, why it works, and which audiences respond best.
What You’ll Track
-
Page performance metrics: Track total page views, unique page views, clicks, and click-through rate to assess page visibility and interest.
-
Engagement activity trends: Monitor weekly clicks, likes, shares, and comments to understand how interactions change over time.
-
Reach & interaction comparison: Compare engagement rate with click-through rate and analyze impressions versus unique impressions to evaluate content reach and resonance.
-
Follower demographics insights: Analyze followers by seniority level, industry, and job function to align content strategy with the right audience.
All dashboards are fully customizable, allowing you to add KPIs or metrics as needed.
How It Works
Why Bold BI Is the Right Fit for LinkedIn Analytics
Bold BI is built to handle high-volume LinkedIn engagement and campaign data without performance or visibility gaps.
With Bold BI, you can:
-
Monitor followers, impressions, clicks, and engagement trends.
-
Track post performance and campaign effectiveness over time.
-
Analyze audience growth, engagement rate, and content impact.
-
Break down performance by post type, campaign, or date range.
-
Deploy dashboards in cloud or self-hosted environments.
Compare Options (at a glance)
| Feature | Bold BI | LinkedIn Native Analytics | Spreadsheets |
| Follower growth & trend tracking | Yes | Limited | Manual |
| Post & content performance analysis | Yes | Partial | Manual |
| Engagement metrics (likes, comments, shares) | Yes | Yes | Manual |
| Campaign & lead performance insights | Yes | Limited | No |
| Executive-ready dashboards | Yes | Limited | No |
Frequently Asked Questions
More Articles About LinkedIn & Social Media Analytics
-
3 Must-Have Social Media Analytics Dashboard Examples
 Discover how social media analytics dashboards in Bold BI help track engagement, analyze performance trends, and deliver actionable insights using LinkedIn, Facebook Ads, and YouTube dashboard examples.
-
How to Create a Website Analytics Dashboard in Bold BI
This video demonstrates how to build a website analytics dashboard in Bold BI using PostgreSQL, key widgets, and expressions to visualize and format insights effectively.