
Supply Chain
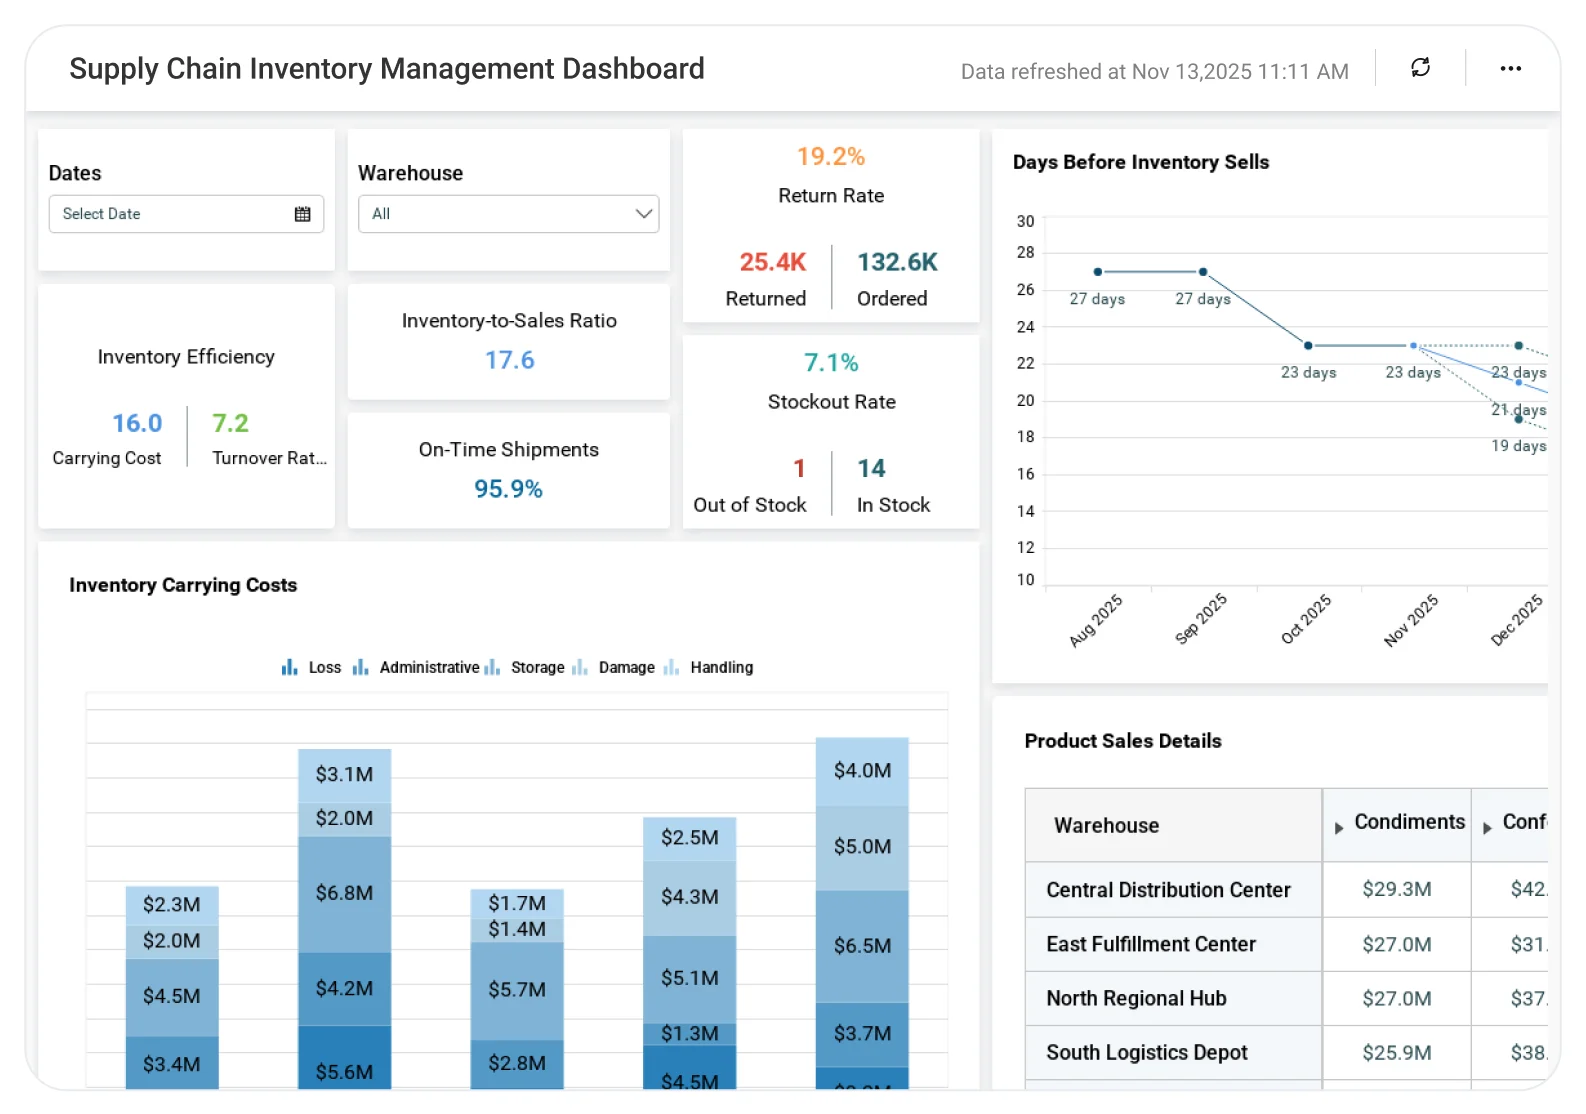
Supply Chain Inventory Management Dashboard
Optimize warehouse operations by improving inventory flow, accuracy, and order fulfillment.
The Warehouse Management Dashboard helps supply chain teams analyze stock movement, order processing, and space utilization, enabling faster fulfillment, reduced errors, and lower operational costs.
TL;DR
What is a Supply Chain Warehouse Management Dashboard?
A Warehouse Management Dashboard provides an analytical view of key inventory metrics to measure performance and operational efficiency across warehouses.
With Bold BI, combine warehouse inventory data with advanced visual analytics. This identifies stock shortages, analyzes carrying costs, and streamlines fulfilment processes.
Why Supply Chain Warehouse Inventory Management Dashboard Matters
Warehouse operations directly impact customer satisfaction, cash flow, and supply chain efficiency. When inventory data is scattered across spreadsheets and systems, teams struggle to detect stock shortages, excess inventory, or rising holding costs in time.
A Supply Chain Warehouse Inventory Management Dashboard brings stock availability, fulfillment performance, and cost metrics into one real-time view. This helps supply chain teams reduce stockouts and backorders, control inventory carrying costs, improve turnover, and make informed replenishment decisions, ensuring the right products are in the right warehouses at the right time.
What You’ll Track
Using Bold BI dashboards, you will track important KPIs such as:
All dashboards can be customizable so you can add KPIs, adjust thresholds, or blend data from sales, logistics, and warehouse systems.
How It Works
Why Bold BI Is the Right Fit for Supply Chain Inventory Management
Bold BI gives warehouse and supply chain teams clear visibility into inventory operations across locations. It helps cut down on stock discrepancies and boosts overall warehouse efficiency.
Compare Options (at a glance)
| Feature | Bold BI | ERP/WMS Inventory Reports | Spreadsheets / Manual Reporting |
|---|---|---|---|
| Stock on hand & inventory valuation (by item/location) | Yes | Yes | Manual |
| Demand vs supply trends & forecasting signals | Yes | Limited | Manual |
| Reorder planning (ROP, safety stock, stockout risk) | Yes | Partial | Manual |
| Inventory turnover, aging & slow/obsolete stock | Yes | Yes | Manual |
| Multi-warehouse visibility & transfer tracking | Yes | Yes | Manual |
| Custom KPIs & dashboards | Fully customizable | Limited to built-in | Manual |
Frequently Asked Questions
More Articles About Supply Chain Inventory Management Dashboard
- Role of Business Intelligence in Supply Chain Management
 This blog explains how BI tools enhance supply chain visibility, improve agility, and optimize inventory for cost savings and better decisions.
- Manage Your Supply Chain Warehouse Efficiently with Embedded AnalyticsThis blog helps you learn how embedded analytics improves warehouse operations, reduces risk, and ensures proper inventory management for efficiency.
Simple Pricing That Grows With You
Say goodbye to hidden costs, complex quotes, and pricing guesswork.
Clear ROI from Day One
No complicated quotes—just honest, value-driven pricing that delivers more for less, right from the start.
Built to Grow with You
From startup to scale-up, Bold BI grows with your business — no forced upgrades, just flexible, future-ready analytics.
Fits Every Budget
Whether you're a startup or an enterprise, our flexible pricing scales with your growth— Pay only for what you truly need.
Trusted & recognized
Analytics that wins awards and users
Recognized by G2, TrustRadius, and Visual Studio Magazine for delivering standout performance and value.
I appreciate Bold BI for making it easier to provide reporting for our customers, allowing both our analysts and customers to easily build and publish reports. The ability to build dashboards and modify queries for specific outcomes is very user-friendly. I value the mobile readiness of the app and its integration capabilities with API structures. The addition of AI features is impressive. The economic pricing model and the effective partnership, which includes consistent and helpful support, make it an invaluable tool for our OEM model.
The support from Bold is unmatched. They do not charge extra for support and it is excellent anyway. All our tickets and questions are quickly answered with authoritative and precise guidance. This is important at the product is complex, powerful and mature. To get the most out of the tool, the level of support they provide is essential.
It was easy to implement data visualizations into our product. The standard widgets allowed us to build professional looking dashboards, and a robust API provided excellent control of the development and runtime process from within our application.



Recognition








Ready to Get Started?
Start your 30-day free trial instantly
Easy integration, AI-Powered Dashboards and 24x5 real-time support.